Fig. 4.
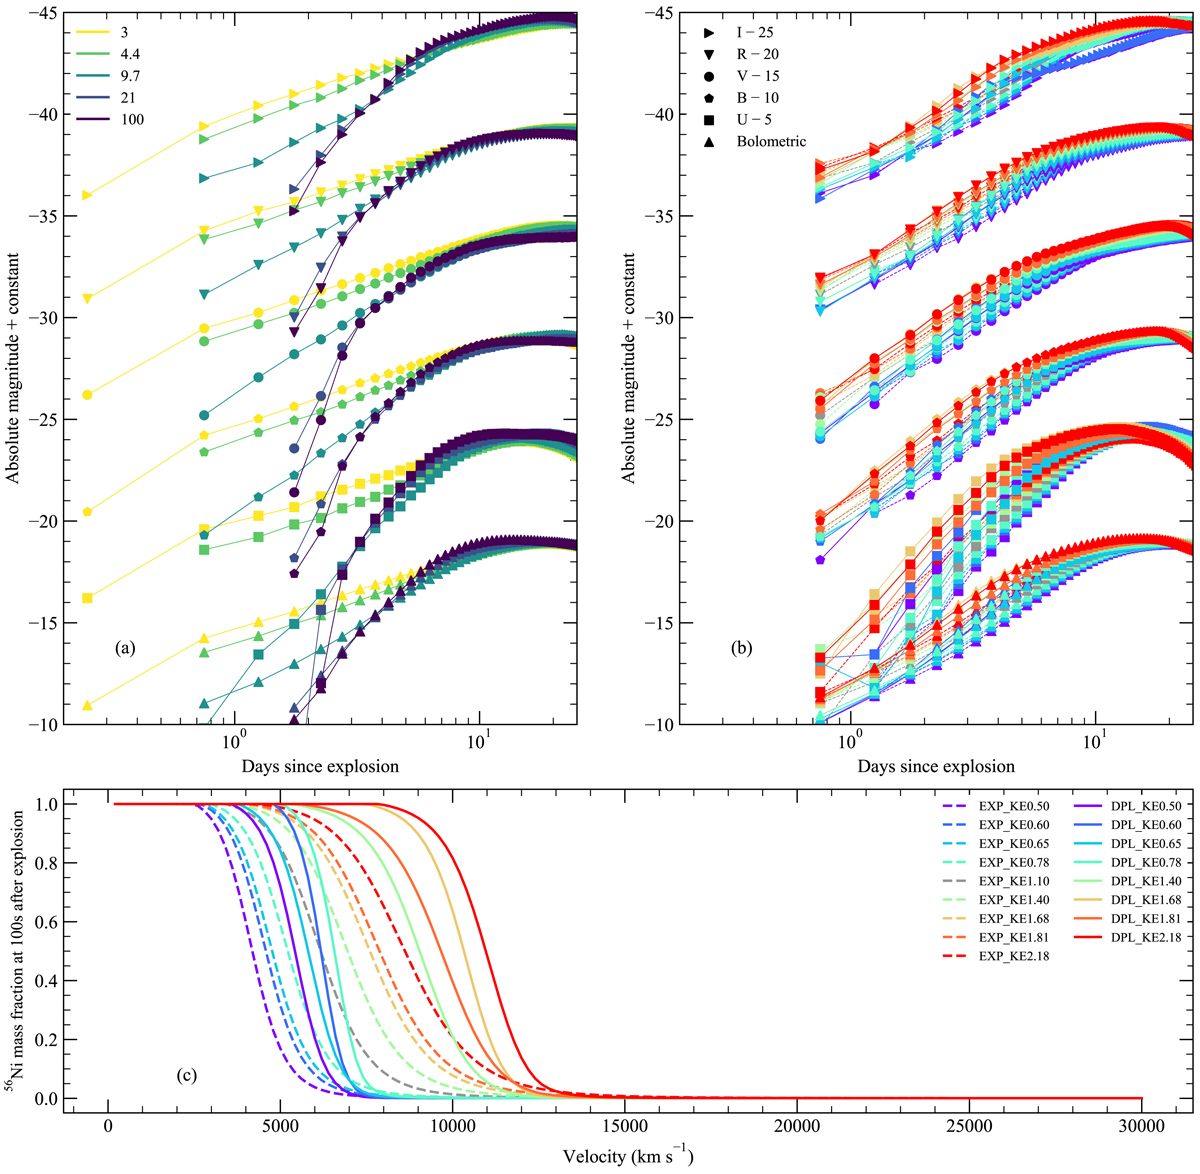
Diversity of light curves for different 56Ni distributions and density profiles. Panel a: light curves are shown for our EXP_Ni0.6_KE1.10 model with different scaling parameters and 56Ni distributions calculated from the Eq. (5). Symbols show different bands of observations, which have been arbitrarily offset. The legend for symbols in panels a and b, is given in panel b. Models with smaller scale parameters (i.e. more extended 56Ni distributions) show brighter light curves at early times. Panel b: light curves calculated with different density profiles are shown for the case of models with 0.6 M⊙ of 56Ni and a scale parameter of s = 9.7. Colours in panel b are as in panel c. Panel c: density profiles for light curves shown in panel b. All models have a maximum velocity of 30 000 km s−1.
Current usage metrics show cumulative count of Article Views (full-text article views including HTML views, PDF and ePub downloads, according to the available data) and Abstracts Views on Vision4Press platform.
Data correspond to usage on the plateform after 2015. The current usage metrics is available 48-96 hours after online publication and is updated daily on week days.
Initial download of the metrics may take a while.