Free Access
Fig. 16.
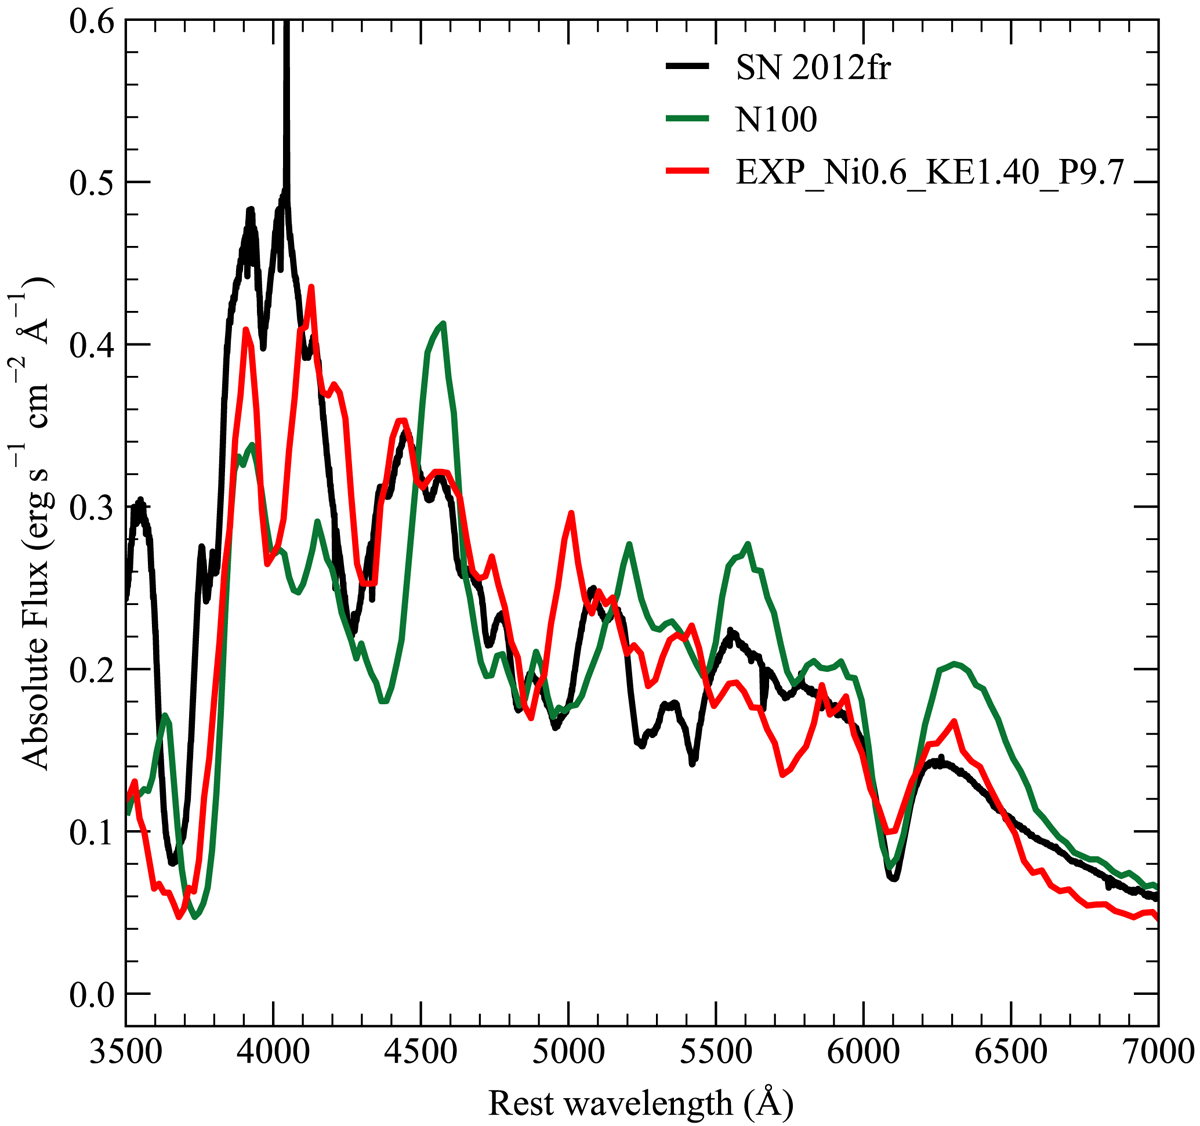
Spectral comparison of SN 2012fr (black), our best matching model (red), and the N100 DDT model (Seitenzahl et al. 2013) at 18 days after explosion. Spectra are shown on an absolute flux scale.
Current usage metrics show cumulative count of Article Views (full-text article views including HTML views, PDF and ePub downloads, according to the available data) and Abstracts Views on Vision4Press platform.
Data correspond to usage on the plateform after 2015. The current usage metrics is available 48-96 hours after online publication and is updated daily on week days.
Initial download of the metrics may take a while.