Fig. 15.
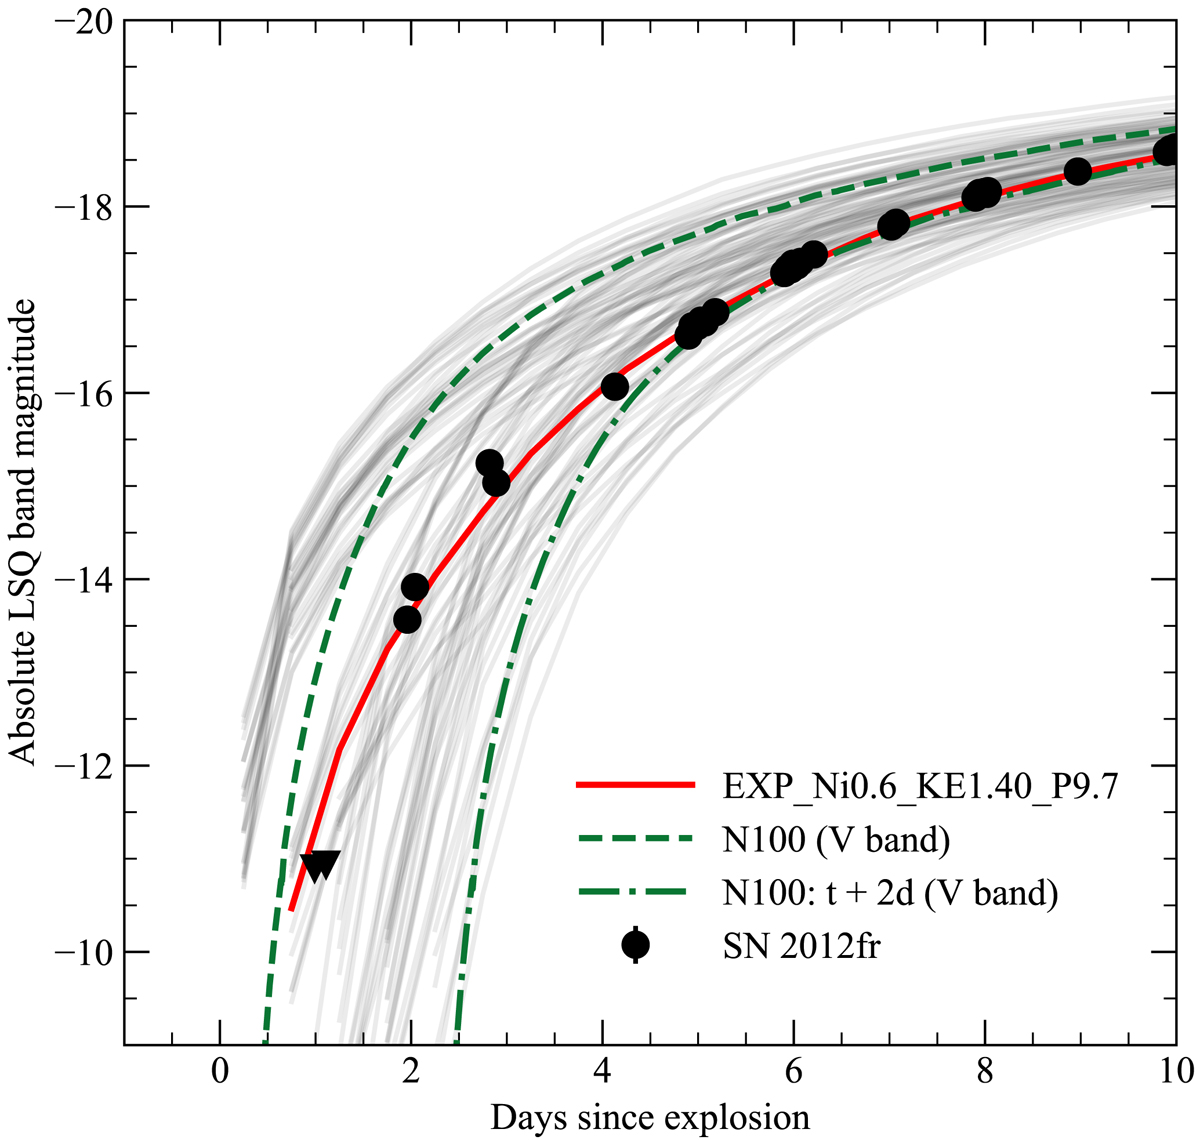
Light curve comparison of SN 2012fr (black), our best matching model (red), and the N100 DDT model (green; Noebauer et al. 2017). Light curves for our model and SN 2012fr are shown in the LSQ band, while the DDT model is shown in the V-band, which our modelling shows is extremely similar to LSQ. The N100 model shows a much sharper rise than is exhibited by SN 2012fr and our best matching model. Offsetting the N100 model by 2 d, we find that is does produce favourable agreement beginning approximately 4 d after explosion.
Current usage metrics show cumulative count of Article Views (full-text article views including HTML views, PDF and ePub downloads, according to the available data) and Abstracts Views on Vision4Press platform.
Data correspond to usage on the plateform after 2015. The current usage metrics is available 48-96 hours after online publication and is updated daily on week days.
Initial download of the metrics may take a while.