Fig. 10.
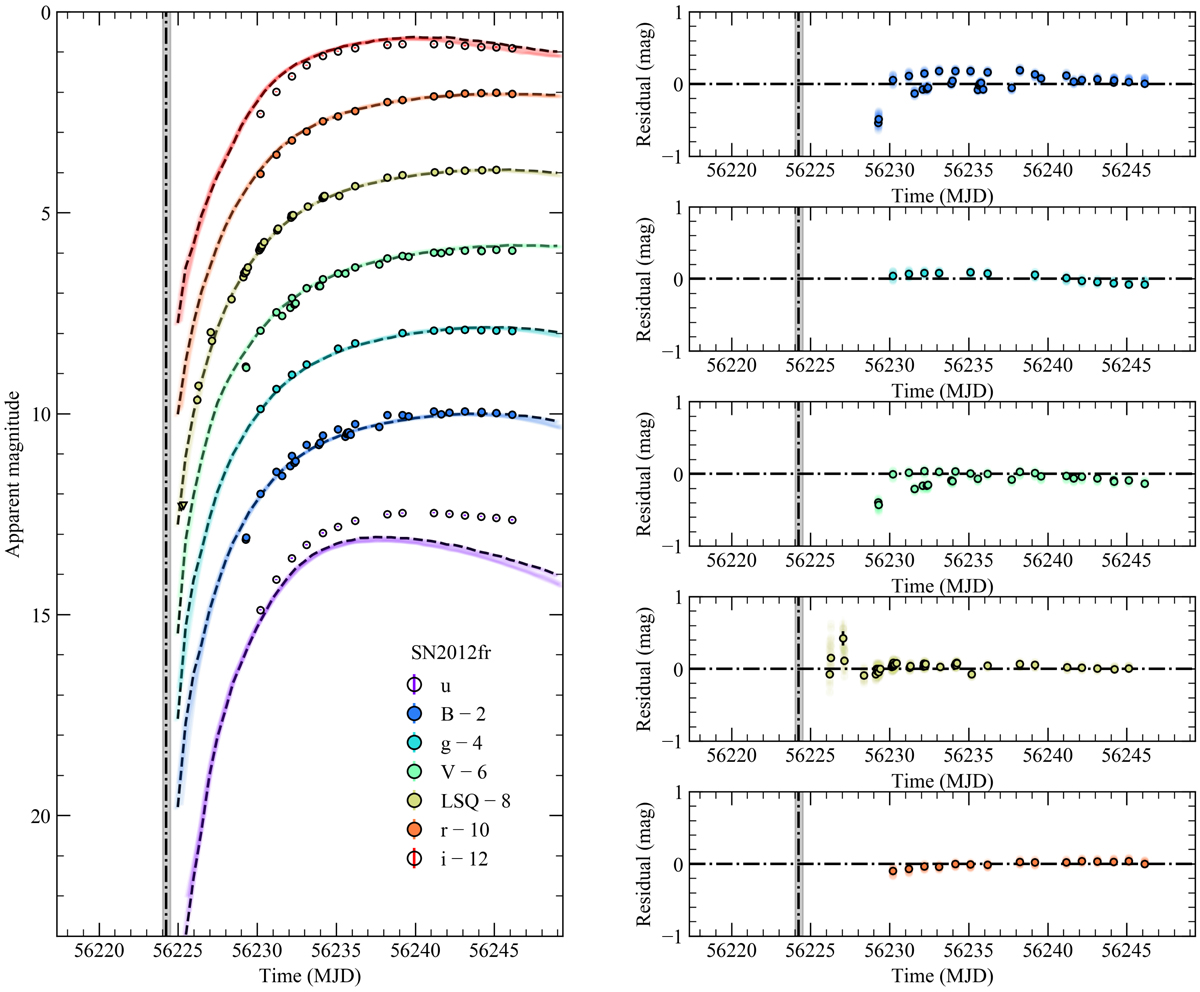
Light curves and residuals of the best matching models for SN 2012fr within the 3σ range. Left: observations used in calculating the χ2 value are shown as filled circles, while those not included in the fit are shown as unfilled circles. Any epochs of < 3σ detections are considered upper limits and shown as triangles. The lowest χ2 model is shown as a dashed line, while the shaded colour regions show the models within the 3σ range. The range of possible explosion dates is given by the shaded grey region with the best match explosion date denoted by a dash-dot line. Right: residuals of the best matching models within the 3σ range compared to observations of SN 2012fr. The lowest χ2 model is denoted by points with a black outline.
Current usage metrics show cumulative count of Article Views (full-text article views including HTML views, PDF and ePub downloads, according to the available data) and Abstracts Views on Vision4Press platform.
Data correspond to usage on the plateform after 2015. The current usage metrics is available 48-96 hours after online publication and is updated daily on week days.
Initial download of the metrics may take a while.