Fig. A.2.
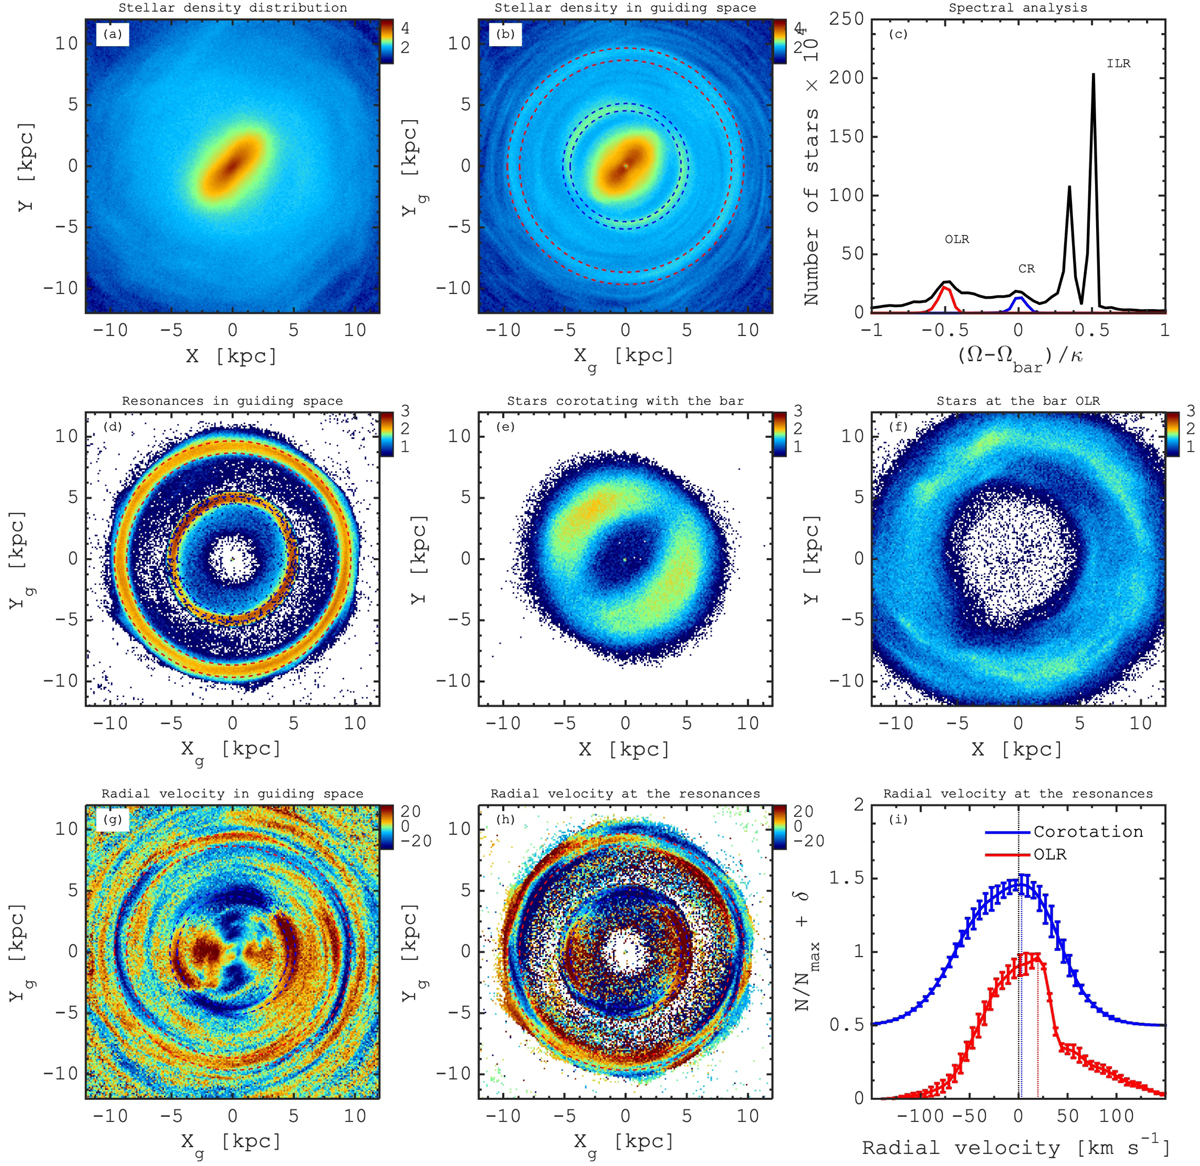
Milky Way-type galaxy simulation (Model II) showing structures near the bar resonances. Panel a: face-on map of the stellar surface density. Panel b: stellar surface density in the guiding space. Two distinct quasi-circular overdensities appear close to the end of the bar and in the outer disc indicated by blue and red circles, respectively. Panel c: spectral analysis of orbits of stars where the fraction of stars with different F = (Ω − Ωbar)/κ ratio is shown for all disc stars (black) and stars between the blue and red circles in frame (b). Frequency ratios of −0.5, 0, and 0.5 correspond to the main resonances of the bar, the outer Lindblad, corotation, and inner Lindblad resonances, respectively. Panel d: guiding space density distribution of stars at the bar corotation (|F| < 0.05) and at the OLR (|F + 0.5| < 0.05). Panel e: density distribution of stars corotating with the bar in spatial coordinates. Panel f: density distribution of stars at the bar OLR in spatial coordinates. Panel g: mean radial velocity distribution of all stars in the guiding space. Panel h: mean radial velocity distribution of stars at the bar corotation and the OLR in the guiding space. Panel i: distributions of the radial velocities of stars at the bar corotation (blue) and at the OLR (red).
Current usage metrics show cumulative count of Article Views (full-text article views including HTML views, PDF and ePub downloads, according to the available data) and Abstracts Views on Vision4Press platform.
Data correspond to usage on the plateform after 2015. The current usage metrics is available 48-96 hours after online publication and is updated daily on week days.
Initial download of the metrics may take a while.