Fig. 6.
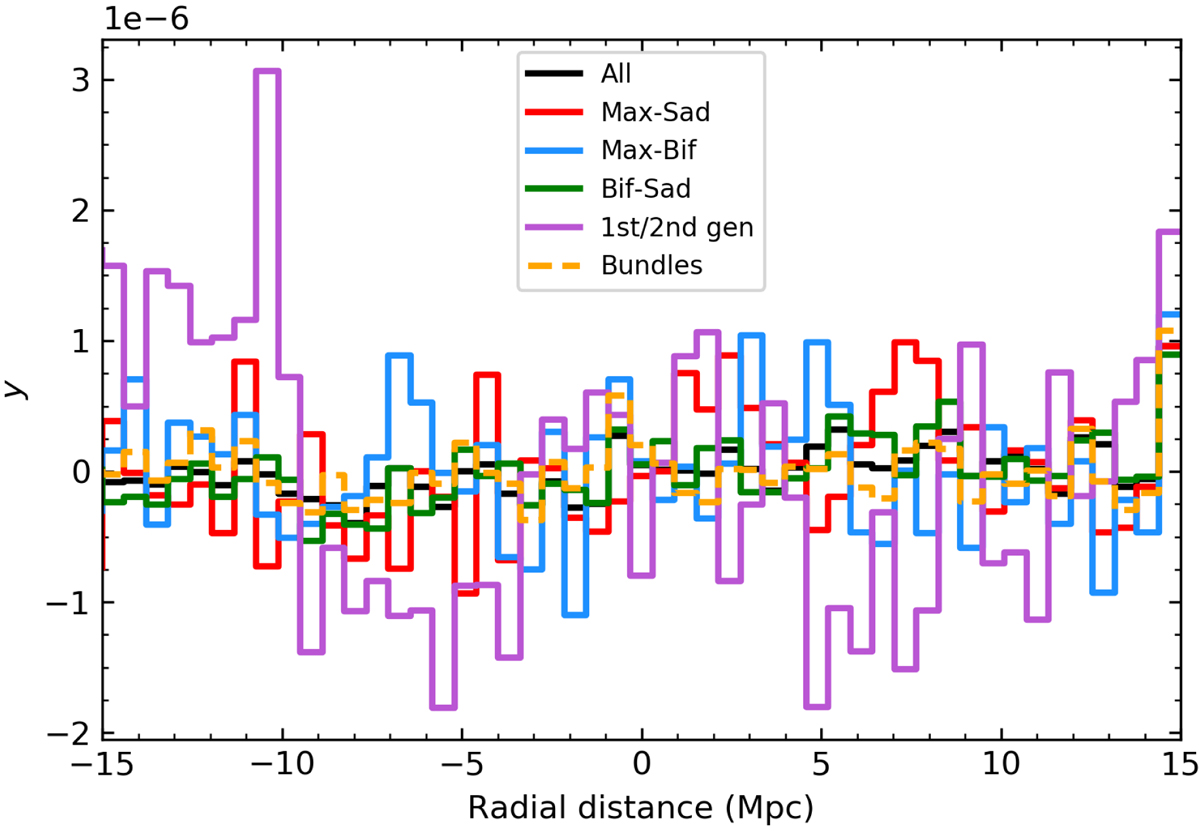
Filament profiles in the SZ. The black line is the average of the collapsed profiles for all filaments in the Coma region. Cyan, red, and green lines are the average of the collapsed profiles for filaments between maxima and saddles, maxima and bifurcations, and bifurcations and saddles, respectively. The purple line is the profile for the first- and second-generation filaments, while the orange dashed line is the profile for the filaments in beams. Each profile has been normalised to its own individual mean.
Current usage metrics show cumulative count of Article Views (full-text article views including HTML views, PDF and ePub downloads, according to the available data) and Abstracts Views on Vision4Press platform.
Data correspond to usage on the plateform after 2015. The current usage metrics is available 48-96 hours after online publication and is updated daily on week days.
Initial download of the metrics may take a while.