Fig. 4.
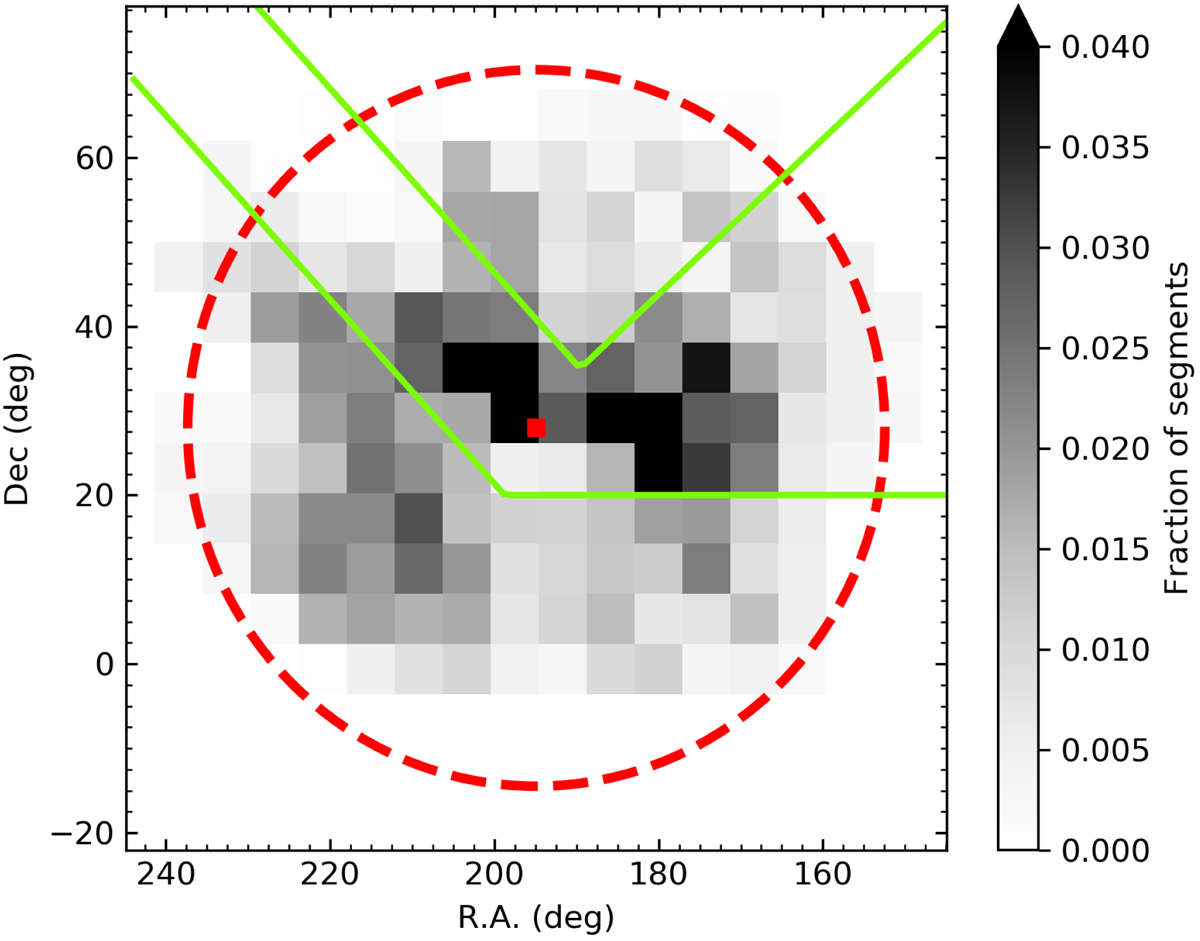
Map of the filament bundles in the Coma cluster region. The grayscale histogram shows the fraction of filaments that cross a given pixel regardless of persistence threshold and smoothing level. The red dashed circle has a radius of 75 comoving Mpc and shows the projection of the sphere around Coma which we considered for our analysis. The position of the Coma cluster is marked by the red square. Green lines show the region inside which we derived some of the profiles described in Sect. 5. North is up and east is to the left.
Current usage metrics show cumulative count of Article Views (full-text article views including HTML views, PDF and ePub downloads, according to the available data) and Abstracts Views on Vision4Press platform.
Data correspond to usage on the plateform after 2015. The current usage metrics is available 48-96 hours after online publication and is updated daily on week days.
Initial download of the metrics may take a while.