Fig. 3.
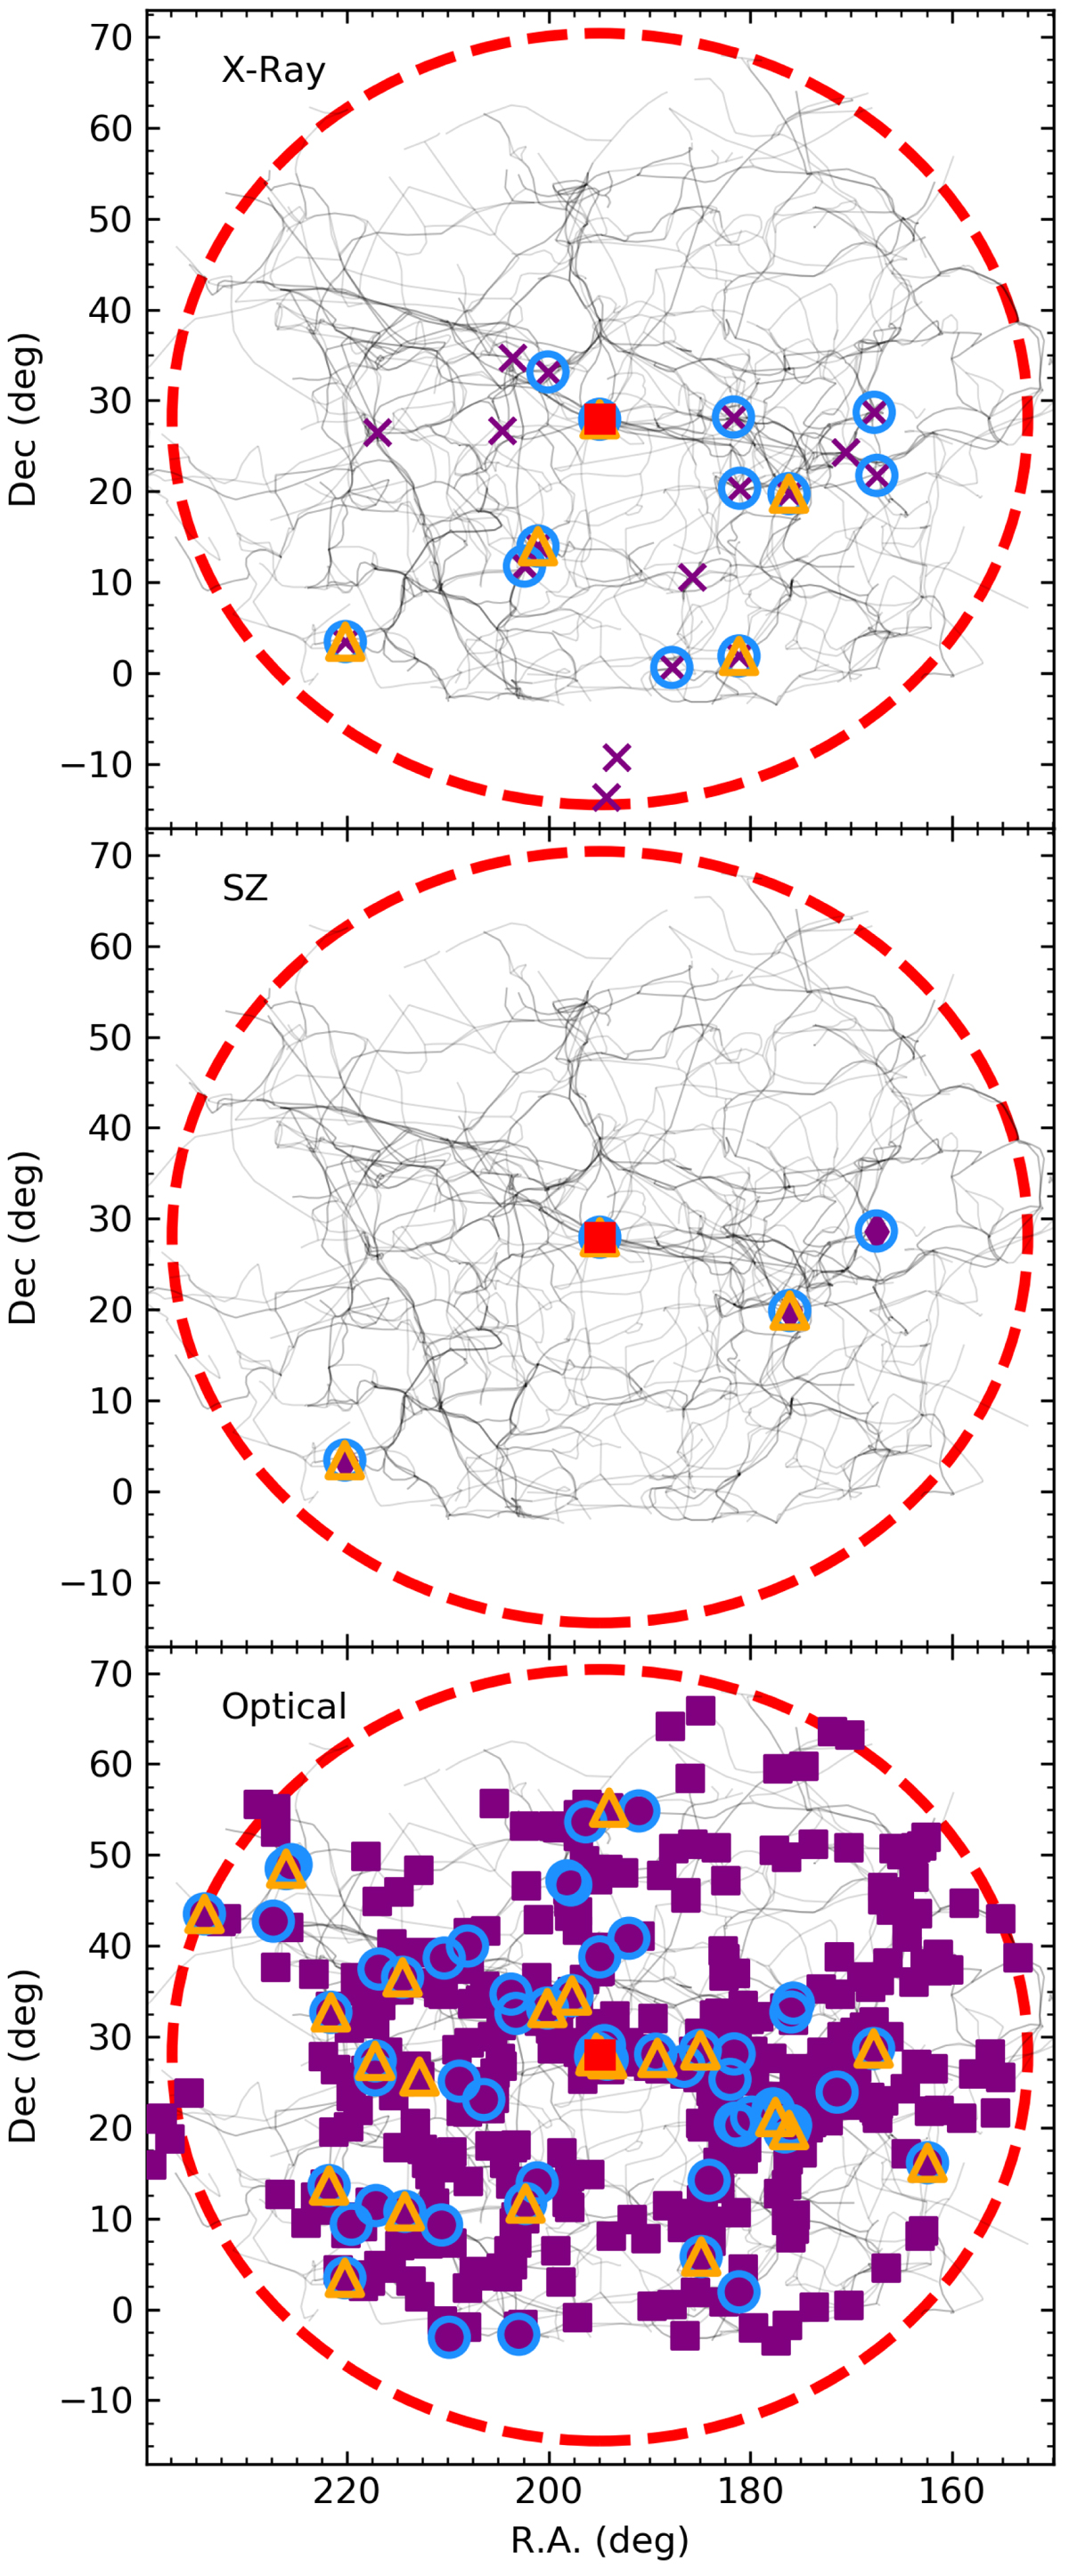
Matches between clusters from the literature (MCXC: top, Planck clusters: middle, SDSS optical groups from Tempel et al. 2017: bottom) and critical points and filaments. Purple crosses, diamonds, and squares mark the position of all the clusters or groups within a 75 Mpc sphere centred on the Coma cluster (whose projection on the plane of the sky is marked by the red dashed circle). The position of the Coma cluster is marked by the red square at the centre. Cyan circles mark those clusters or groups which have a match with at least one filament, while orange triangles mark those clusters which have a match with at least one critical point regardless of smoothing and persistence threshold. Black lines in the background show the position of all filaments regardless of smoothing level or persistence threshold. In each panel north is up and east is to the left.
Current usage metrics show cumulative count of Article Views (full-text article views including HTML views, PDF and ePub downloads, according to the available data) and Abstracts Views on Vision4Press platform.
Data correspond to usage on the plateform after 2015. The current usage metrics is available 48-96 hours after online publication and is updated daily on week days.
Initial download of the metrics may take a while.