Fig. 1.
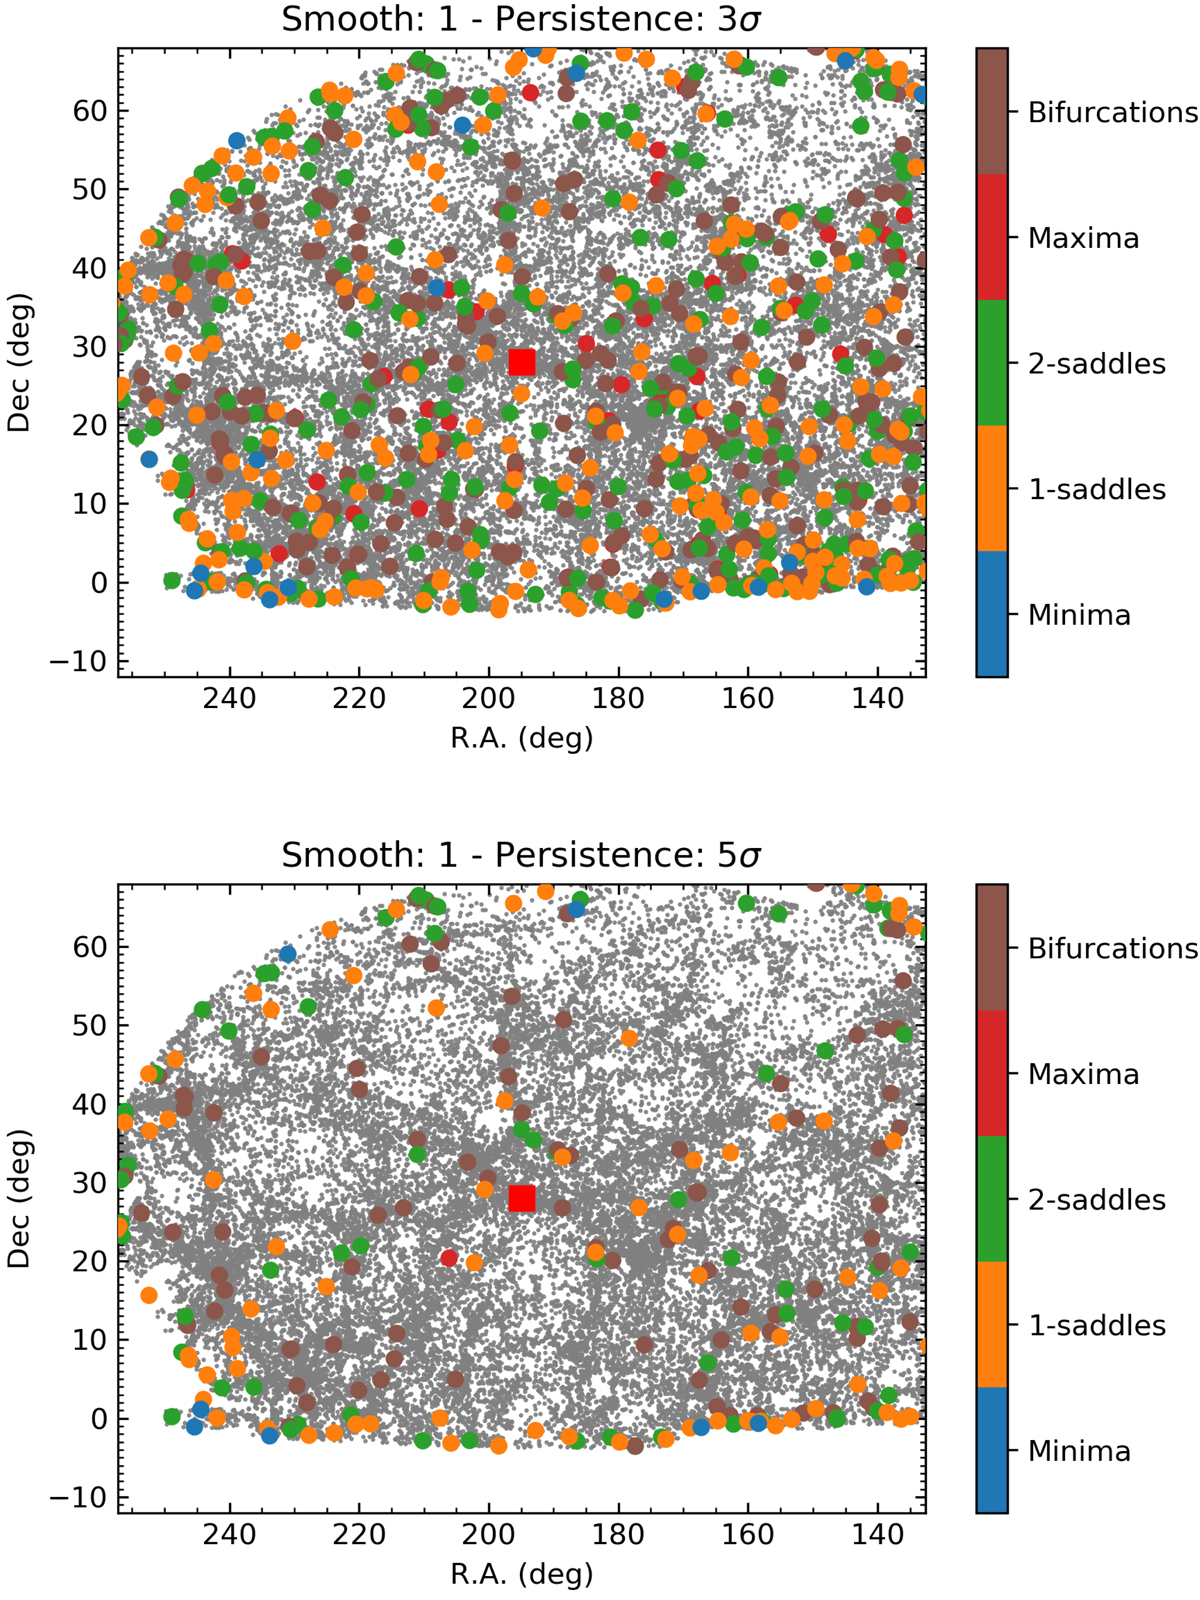
Galaxy and critical point distribution in the Coma supercluster in a ±75 Mpc redshift slice centred on the Coma cluster (marked with the red square). Small grey points represent the position of galaxies from the MGS. Large circles represent critical points colour-coded according to their type. Top panel: 3σ persistence threshold; bottom panel: 5σ persistence threshold. One-smoothing of the density field is applied prior to the filament and critical point detection. North is up, east is to the left.
Current usage metrics show cumulative count of Article Views (full-text article views including HTML views, PDF and ePub downloads, according to the available data) and Abstracts Views on Vision4Press platform.
Data correspond to usage on the plateform after 2015. The current usage metrics is available 48-96 hours after online publication and is updated daily on week days.
Initial download of the metrics may take a while.