Free Access
Fig. 7.
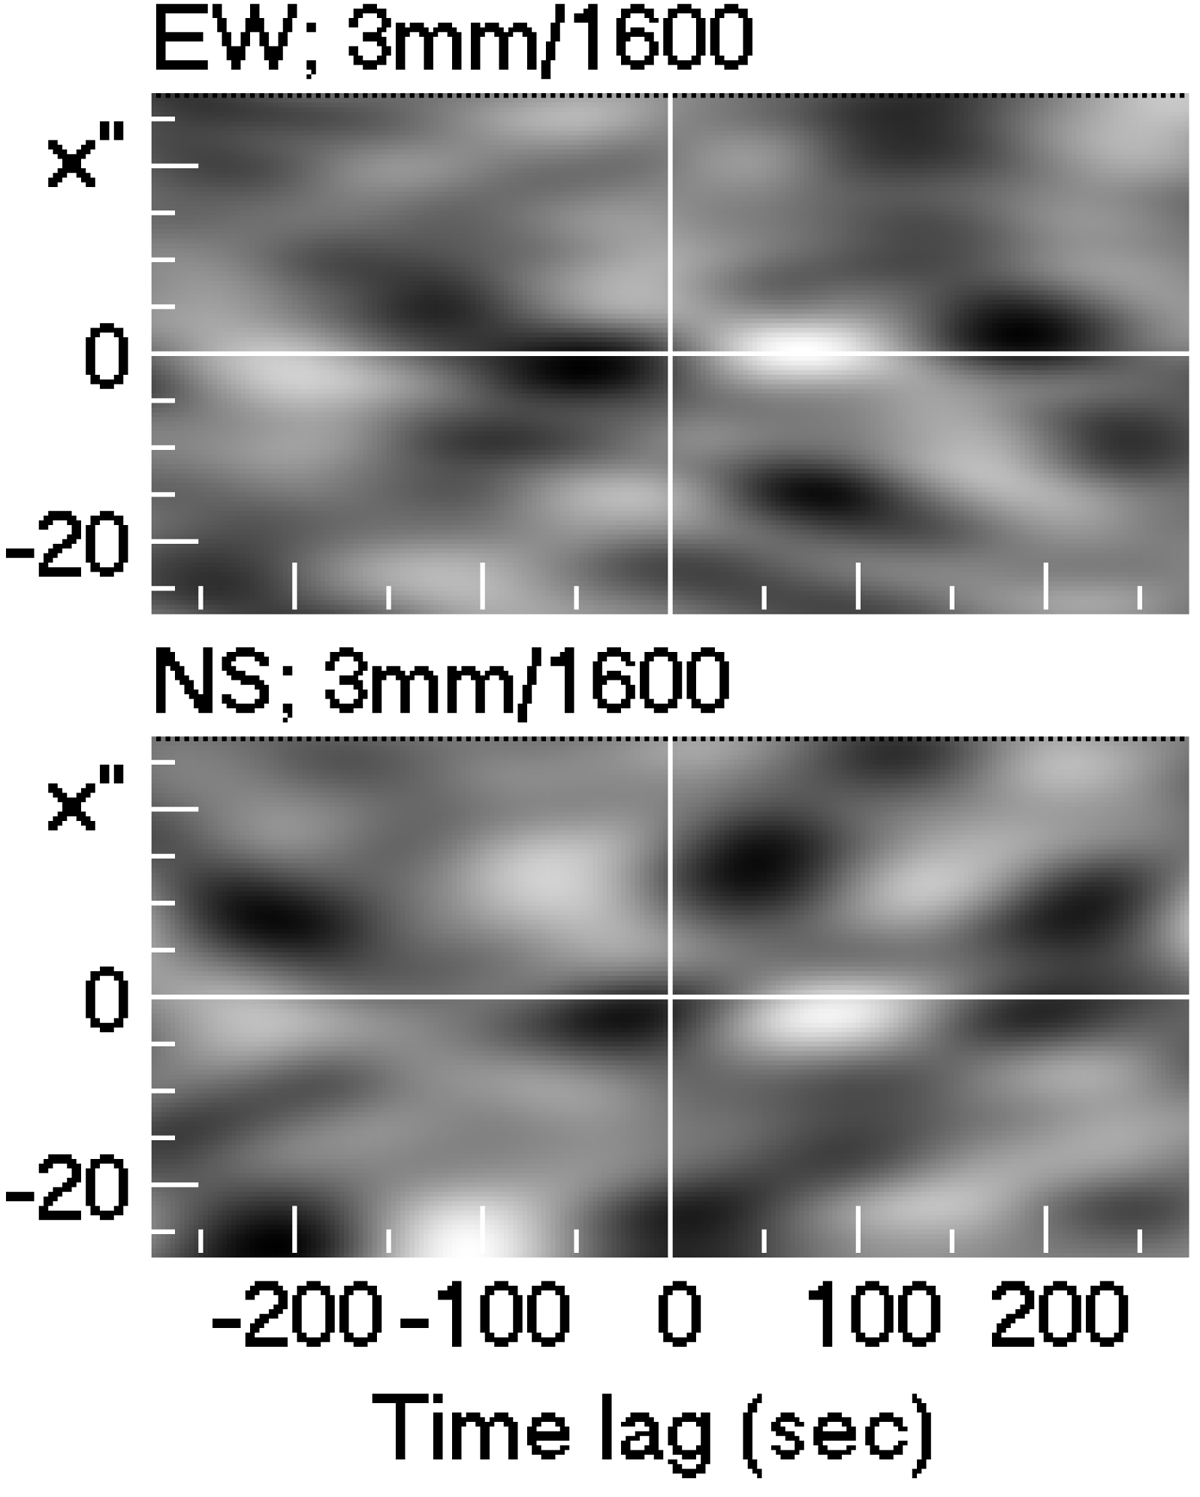
2D cross-correlation maps of the AIA 1600 Å and ALMA 3-mm light curves as a function of temporal lag and location along the employed horizontal (upper panel) and vertical (lower panel) cuts for target 5. White (black) correspond to strong positive (negative) correlation. The range of values is from −0.22 to 0.25.
Current usage metrics show cumulative count of Article Views (full-text article views including HTML views, PDF and ePub downloads, according to the available data) and Abstracts Views on Vision4Press platform.
Data correspond to usage on the plateform after 2015. The current usage metrics is available 48-96 hours after online publication and is updated daily on week days.
Initial download of the metrics may take a while.