Fig. 5.
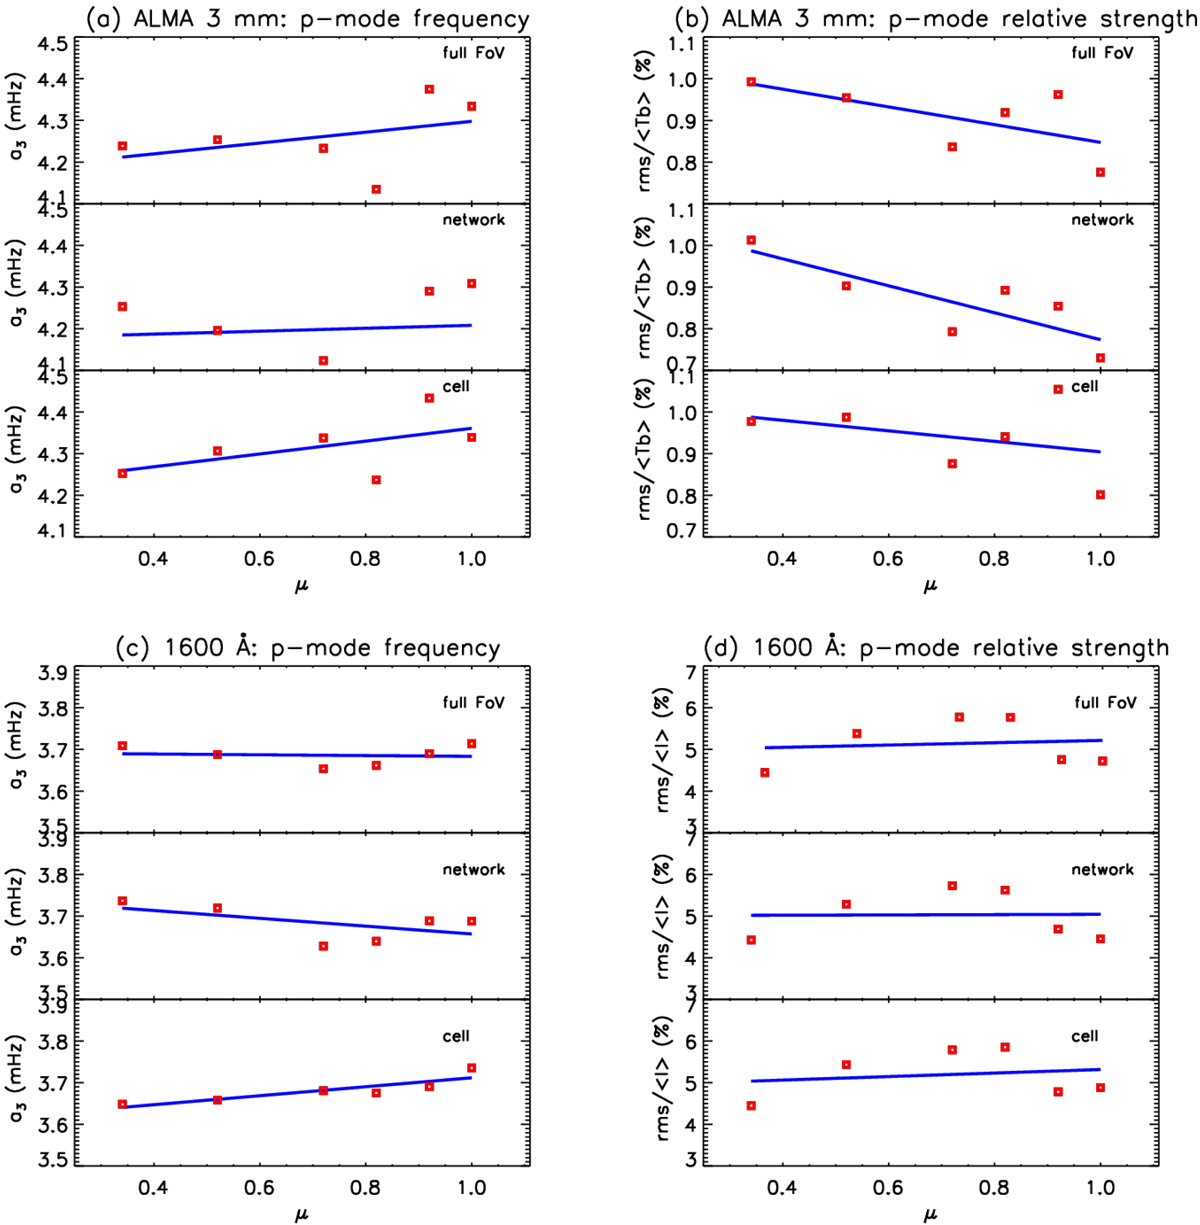
ALMA 3-mm center-to-limb variation (red boxes) for: (a) p-mode frequency (i.e., a3 in Eq. (2)), (b) p-mode relative strength, i.e., rms associated with p-mode/⟨Tb⟩ (%). AIA 1600 Å center-to-limb variation (red boxes) for: (c) p-mode frequency (i.e., a3 in Eq. (2)), (d) p-mode relative strength, i.e., rms associated with p-mode/⟨I⟩ (%). Blue lines correspond to linear fits of the corresponding measurements. In each panel, top, middle, and bottom plots correspond to the entire FoV, network, and cell, respectively.
Current usage metrics show cumulative count of Article Views (full-text article views including HTML views, PDF and ePub downloads, according to the available data) and Abstracts Views on Vision4Press platform.
Data correspond to usage on the plateform after 2015. The current usage metrics is available 48-96 hours after online publication and is updated daily on week days.
Initial download of the metrics may take a while.