Fig. 3.
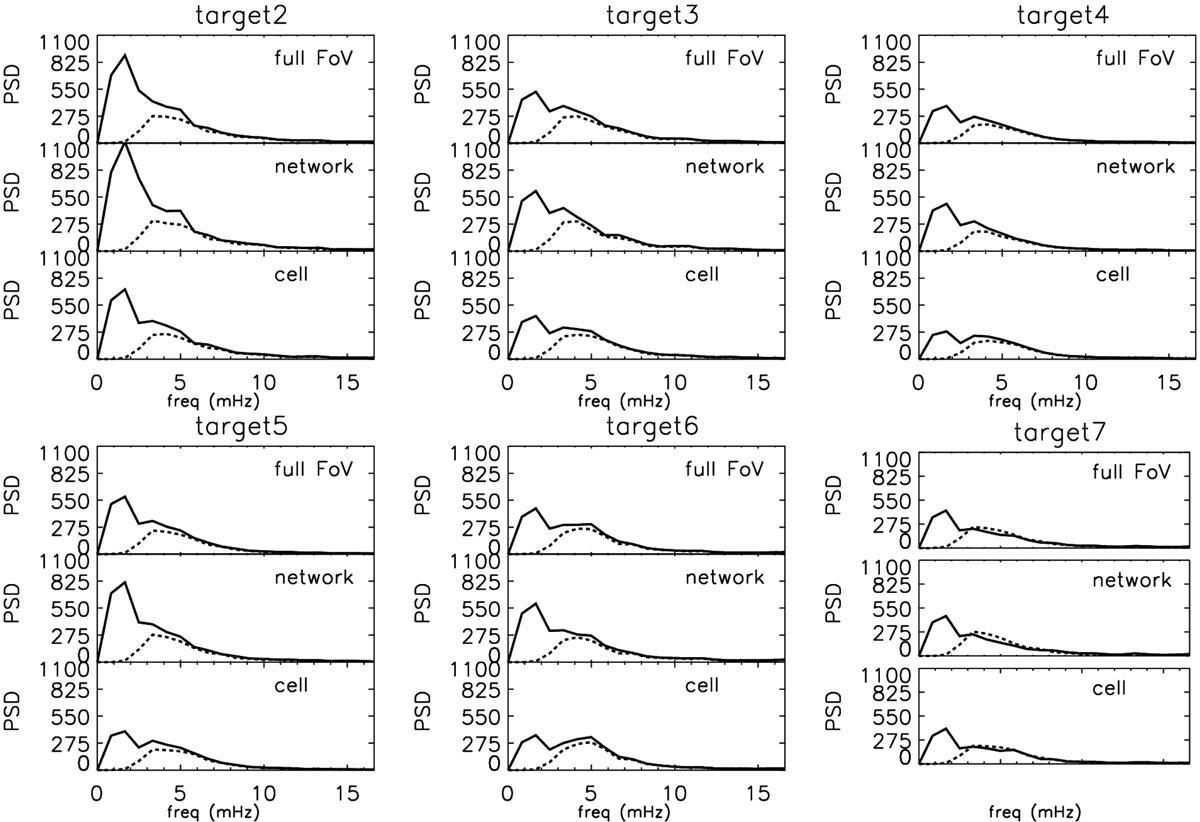
Power spectra from full FoV (first row), network (second row) and cell (third row) for targets 2–7. Solid lines correspond to spectra computed after the subtraction of the average from the light curves of individual pixels, dashed lines show the spectra computed after the subtraction of a third-degree polynomial fit. All spectra have been scaled by a factor equal to 4815 K2 Hz−1.
Current usage metrics show cumulative count of Article Views (full-text article views including HTML views, PDF and ePub downloads, according to the available data) and Abstracts Views on Vision4Press platform.
Data correspond to usage on the plateform after 2015. The current usage metrics is available 48-96 hours after online publication and is updated daily on week days.
Initial download of the metrics may take a while.