Fig. 1.
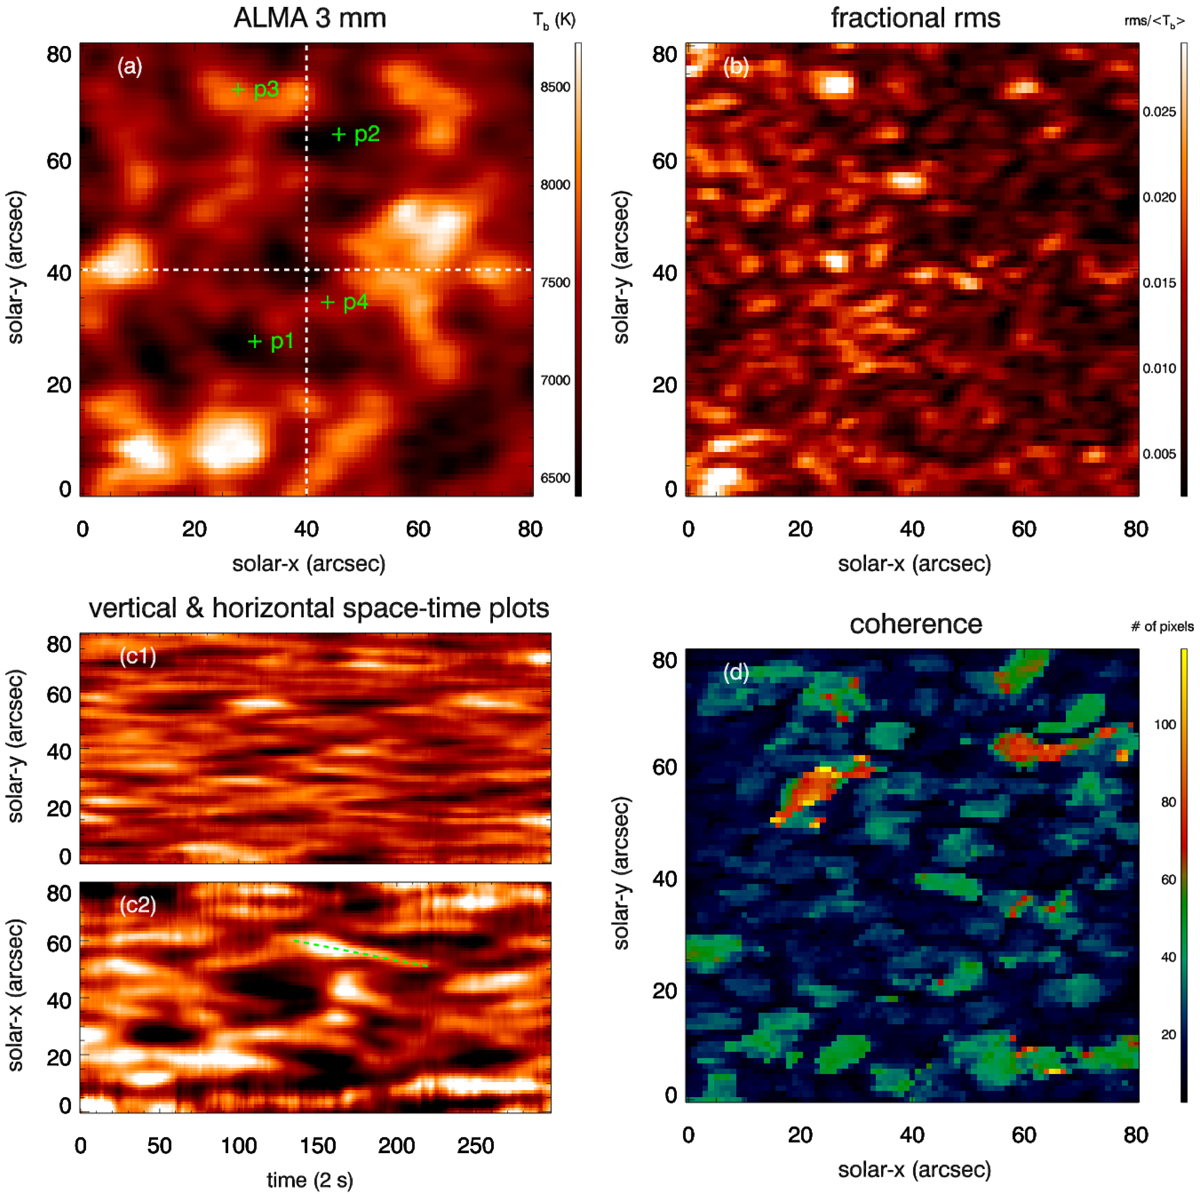
Summary plots for target five. (a): temporally averaged ALMA 3-mm image, (with p1–p4 we show the four pixels used in Fig. 2); (b): fractional rms of Tb; (c): space-time plots of Tb corresponding to a vertical (upper panel) and horizontal (lower panel) cut through the center of image of (a); from each light curve, its temporal average was subtracted, and the color-scale was saturated to differences of ±200 K: (due to the noncircular ALMA beam the resolution in the vertical direction is inferior to that in the horizontal direction: see Table 1 of Nindos et al. 2018; d) coherence map displaying the number of pixels in the neighborhood of each pixel with linear correlation coefficient of the corresponding light curves of at least 0.7. Images are oriented with celestial north up.
Current usage metrics show cumulative count of Article Views (full-text article views including HTML views, PDF and ePub downloads, according to the available data) and Abstracts Views on Vision4Press platform.
Data correspond to usage on the plateform after 2015. The current usage metrics is available 48-96 hours after online publication and is updated daily on week days.
Initial download of the metrics may take a while.