Fig. 5.
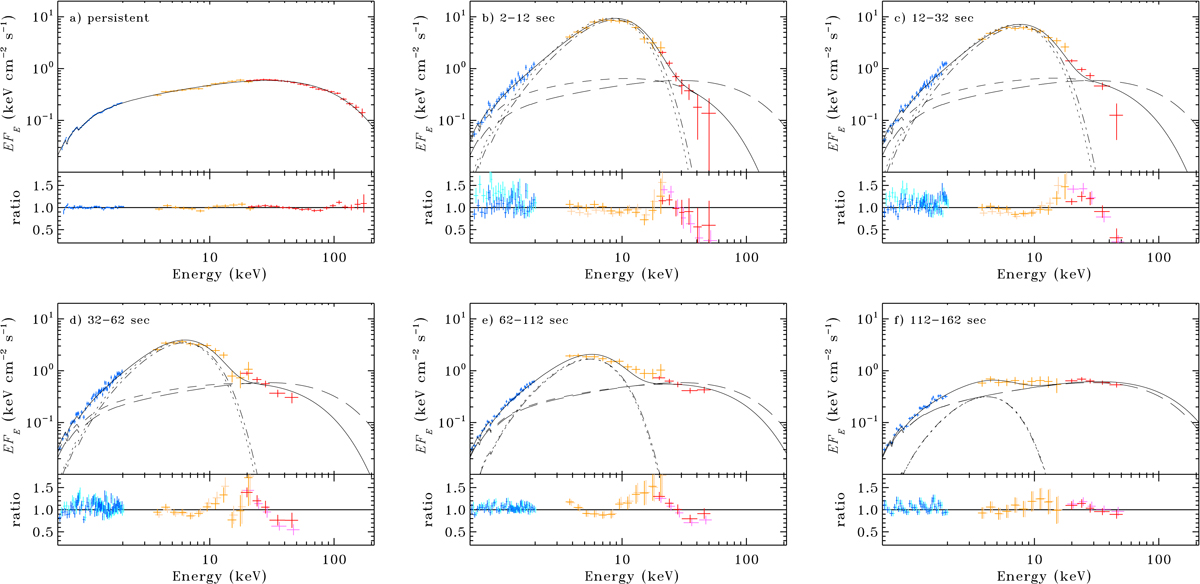
Panel a: average hard-state persistent emission spectrum. Shown are the RGS, JEM-X, and ISGRI spectra (in blue, orange, and red, respectively). Panels b–f: average hard-state burst spectra stacked over the five time intervals shown in Fig. 4. The spectral parameters derived from the fits to these spectra are provided in Table 1. The black continuous line shows the resulting spectra (burst+persistent emission) when fitting the data using Model 3, where the CUTOFFPL normalization and cutoff energy during the burst are treated as free parameters (short-dashed line). The dot-dashed line shows the corresponding blackbody component. Highlighted in the data–model panels (in cyan, brown, and pink) are the residuals in the case where the CUTOFFPL component during the burst had been fixed to the best fitting persistent emission (Model 1, long-dashed line). The dotted line shows the corresponding blackbody component.
Current usage metrics show cumulative count of Article Views (full-text article views including HTML views, PDF and ePub downloads, according to the available data) and Abstracts Views on Vision4Press platform.
Data correspond to usage on the plateform after 2015. The current usage metrics is available 48-96 hours after online publication and is updated daily on week days.
Initial download of the metrics may take a while.