Fig. 4.
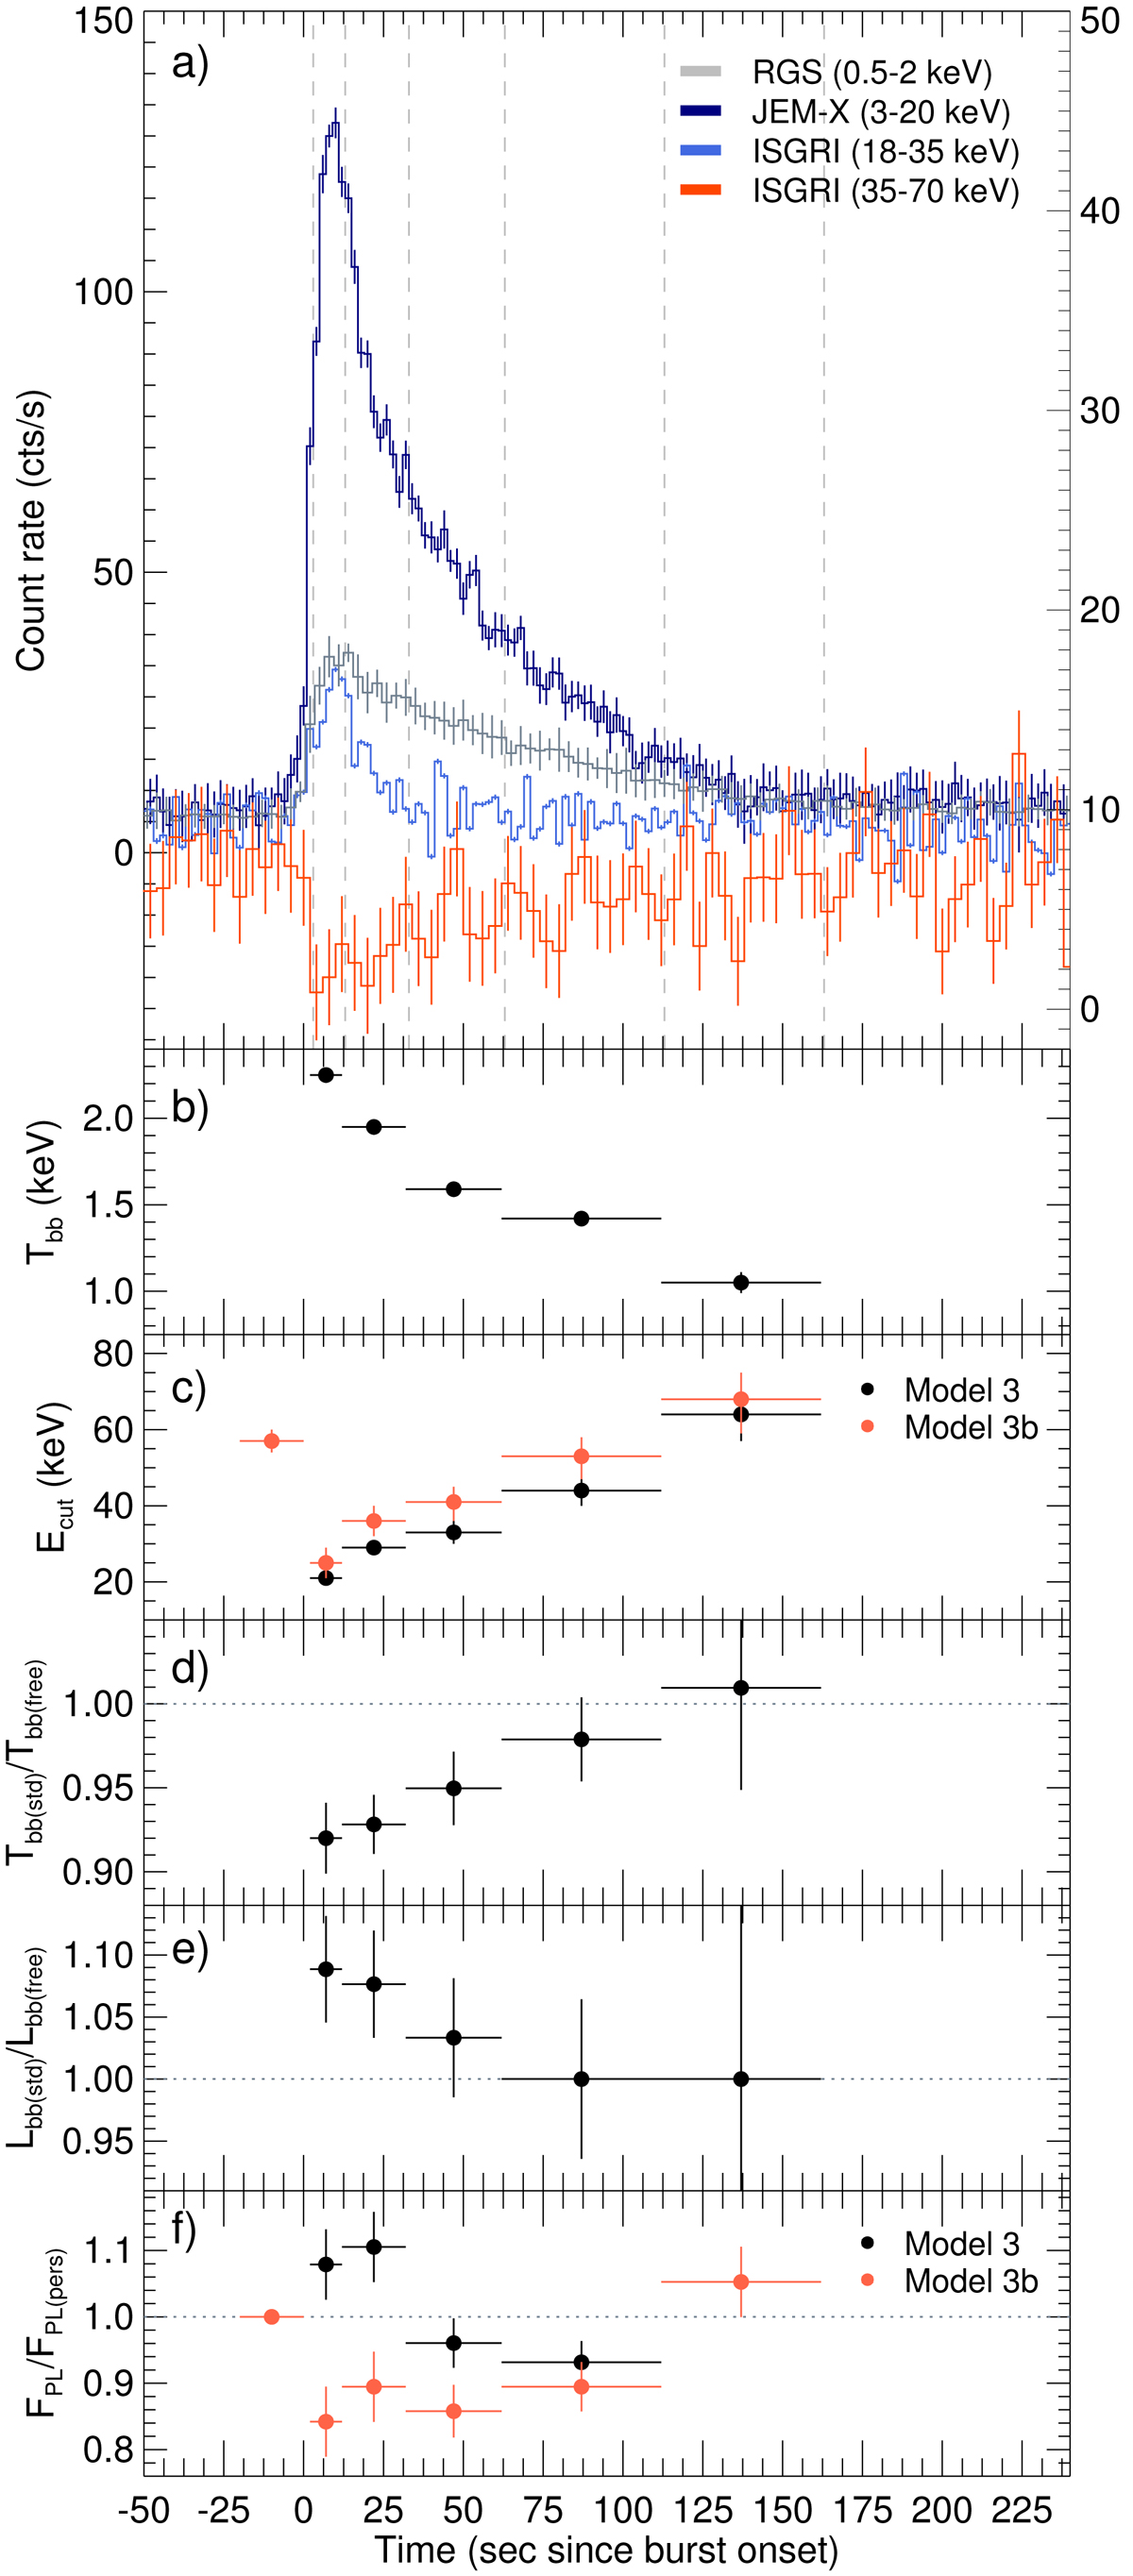
Panel a: average burst profile in four energy bands. The RGS, JEM-X, and IBIS/ISGRI (18–35 keV) light curves refer to the left vertical axis. The IBIS/ISGRI (35–70 keV) light curve refers to the right vertical axes. The profiles were built as described in Sect. 2. The dashed vertical lines indicate the intervals over which the spectra displayed in Fig. 5 were stacked. Panels b and c: evolution of the burst temperature and cutoff energy derived from the fits to the stacked burst spectra, using Model 3 and 3b (free persistent emission parameters). Panels d and e: comparison of the burst temperatures and fluxes derived using the standard fitting procedure (fixed persistent emission parameters: Model 1) with the results derived from Model 3. A dotted line is drawn at the position that equals both values. Panel f: comparison of the power-law flux derived using Models 3 and 3b with the non-bursting persistent emission flux.
Current usage metrics show cumulative count of Article Views (full-text article views including HTML views, PDF and ePub downloads, according to the available data) and Abstracts Views on Vision4Press platform.
Data correspond to usage on the plateform after 2015. The current usage metrics is available 48-96 hours after online publication and is updated daily on week days.
Initial download of the metrics may take a while.