Fig. 1.
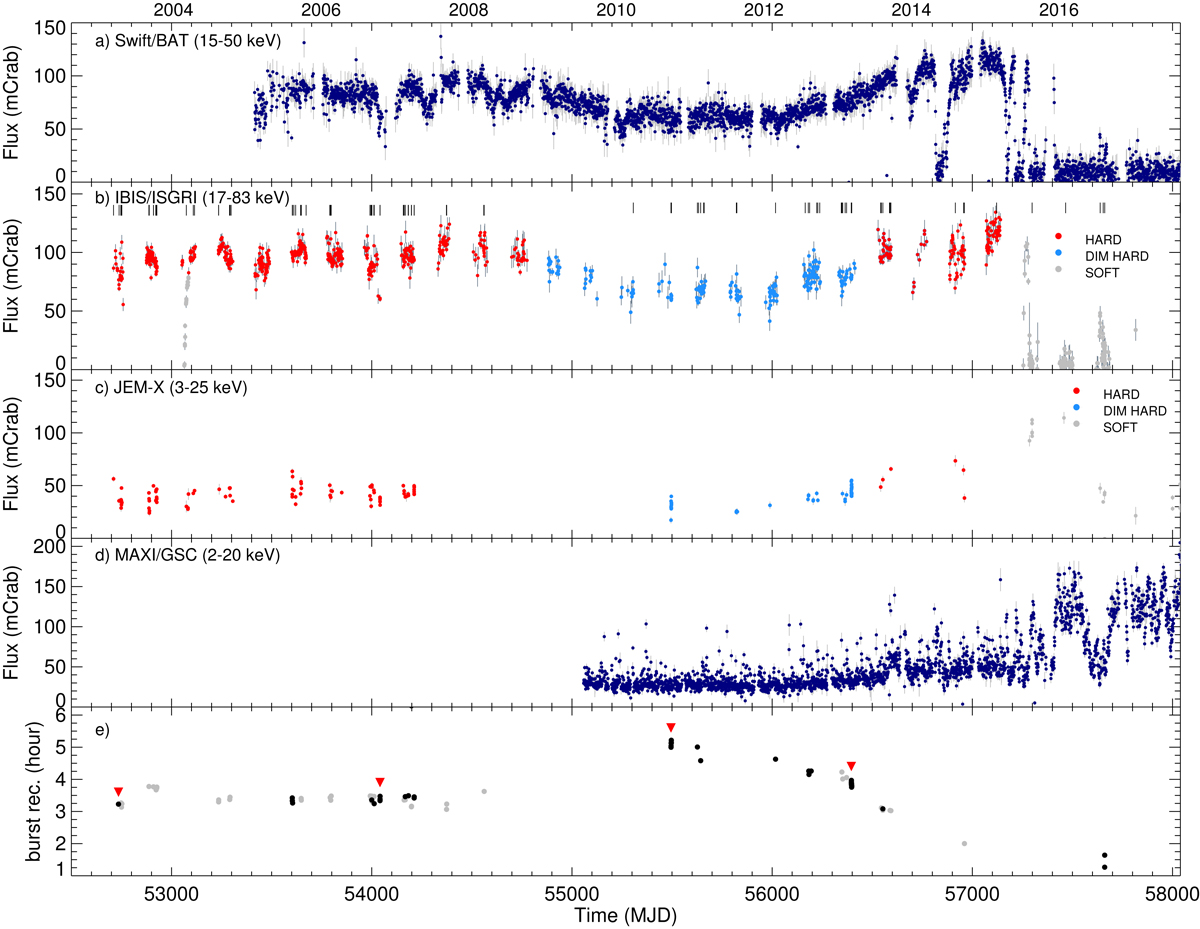
Light curves of GS 1826–24 during the period analysed in this work. Panel a: Swift/BAT light curve in the 15–50 keV energy range. Panel b: IBIS/ISGRI light curve in the 17–83 keV energy range. Shown in red are the hard-state periods (MJD 52700–54800, MJD 54800–56400), and in light blue and grey, respectively, the dim-hard (MJD 54800–54800) and soft-state periods (MJD 56400 onward). The small vertical lines on top of the light curve indicate the times of detection of Type I X-ray bursts by JEM-X. To build a homogeneous sample, and avoid the systematics effects caused by variations of the persistent emission, burst stacking was performed using the hard-state data from the period MJD 52700–54800. Panel c: JEM-X light curve in the 3–25 keV energy range. Panel d: MAXI light curve in the 2–20 keV energy range. Panel e: recurrence times of the Type I X-ray bursts found in this work. Shown in black are the recurrence times measured directly (see examples in Fig. 2) and in grey the derived recurrence times (as described in the text). The red triangles correspond to the times of detection of the four groups of bursts displayed in Fig. 2.
Current usage metrics show cumulative count of Article Views (full-text article views including HTML views, PDF and ePub downloads, according to the available data) and Abstracts Views on Vision4Press platform.
Data correspond to usage on the plateform after 2015. The current usage metrics is available 48-96 hours after online publication and is updated daily on week days.
Initial download of the metrics may take a while.