Fig. 2
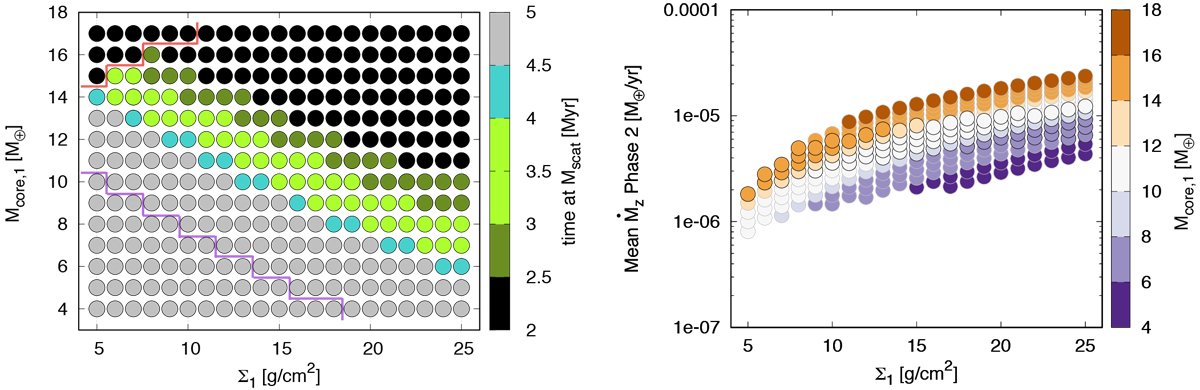
Grid of simulations for a = 5 au and rp = 100 km. Left: mean time to reach the scattering mass as a function of the initial surface density of planetesimals (Σ1) and the initial core mass (Mcore,1). The light green colour indicates the cases compatible with the meteoritic record. For grey circles the growth is too slow (longer than 4.5 Myr), and for black ones, too fast (shorter than 2.5 Myr). Points in the upper left corner above the red line are supercritical and their structure cannot be computed. Points in the lower left corner below the purple line correspond to cases whose growth is so slow that the mass of Jupiter is not reached within 10 Myr of disc evolution. Right: mean accretion rate of solids during Phase 2 as a function of the initial surface density of planetesimals. The initial core mass is shown in the colour-bar. Circles with black border represent cases where the meteoritic constraints are fulfilled (green band of left panel).
Current usage metrics show cumulative count of Article Views (full-text article views including HTML views, PDF and ePub downloads, according to the available data) and Abstracts Views on Vision4Press platform.
Data correspond to usage on the plateform after 2015. The current usage metrics is available 48-96 hours after online publication and is updated daily on week days.
Initial download of the metrics may take a while.