Fig. 3.
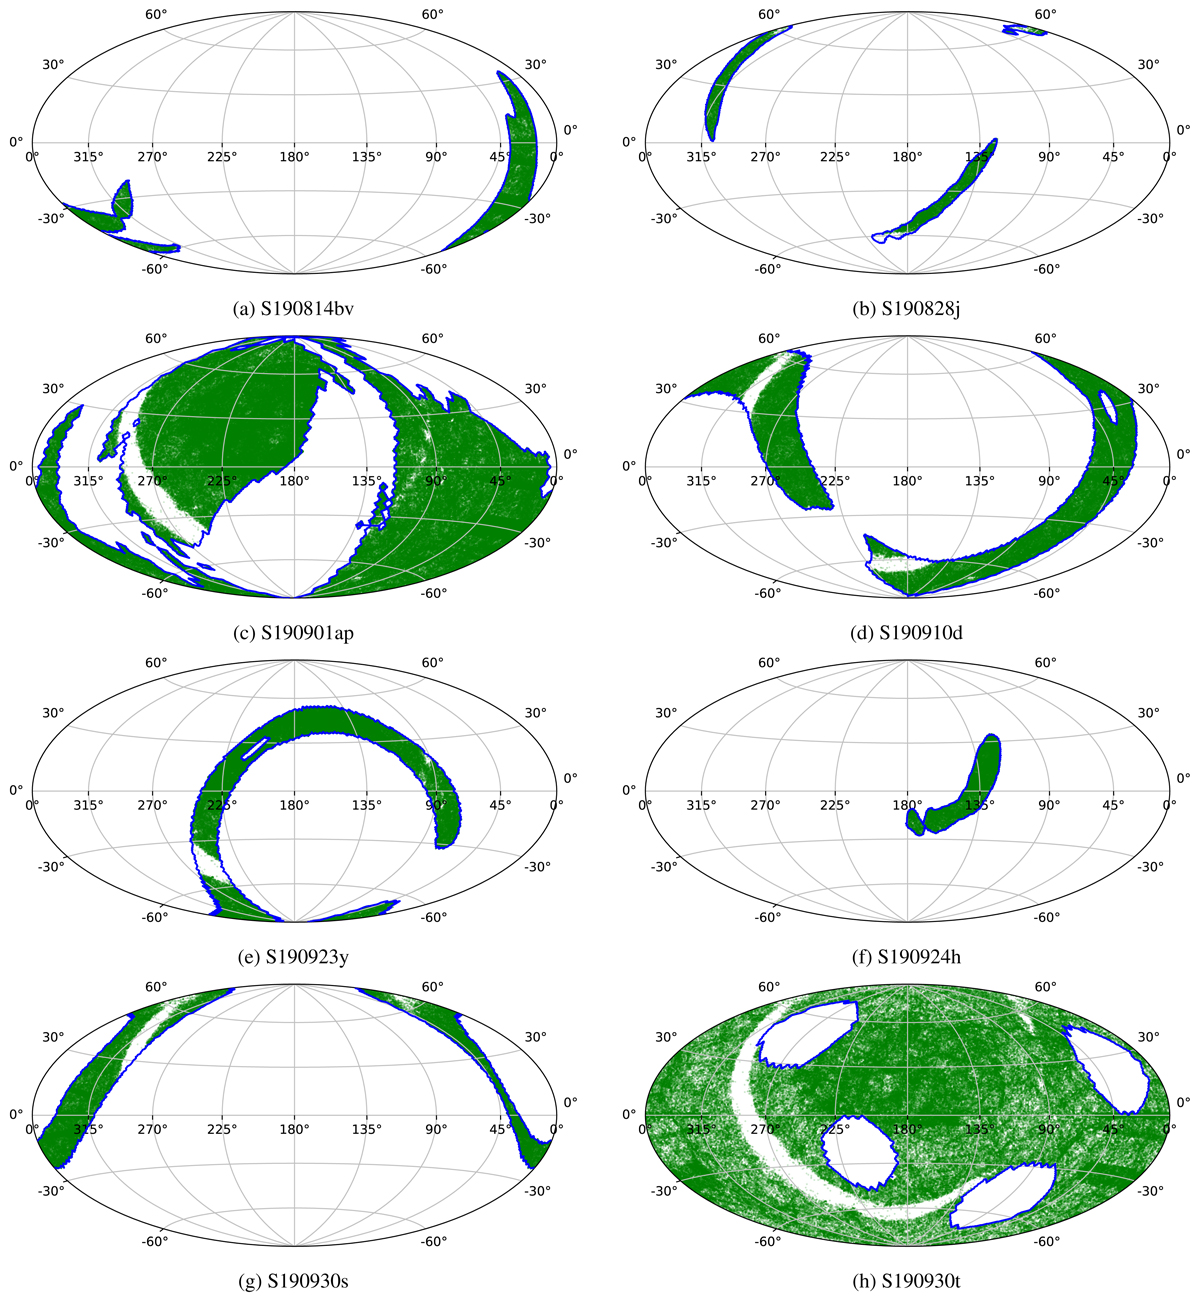
99% contour regions (blue lines) and galaxies from the filtered GLADE V2 catalogue (green points) which lie within these regions for a sample of initial sky maps for GW events from O3. We note that the galaxies are filtered based on the LVC distance estimate and error, within ±5 DISTSTD. These localisation regions are often irregularly shaped and have varied sizes. The uneven coverage of the filtered GLADE V2 catalogue is evident in these figures, especially in Fig. 3h. The galaxy density in each sky map is different due to the differing distance estimates (and completeness of the galaxy catalogue to that distance) and the magnitude of the corresponding standard deviations on distance.
Current usage metrics show cumulative count of Article Views (full-text article views including HTML views, PDF and ePub downloads, according to the available data) and Abstracts Views on Vision4Press platform.
Data correspond to usage on the plateform after 2015. The current usage metrics is available 48-96 hours after online publication and is updated daily on week days.
Initial download of the metrics may take a while.