Free Access
Fig. 8.
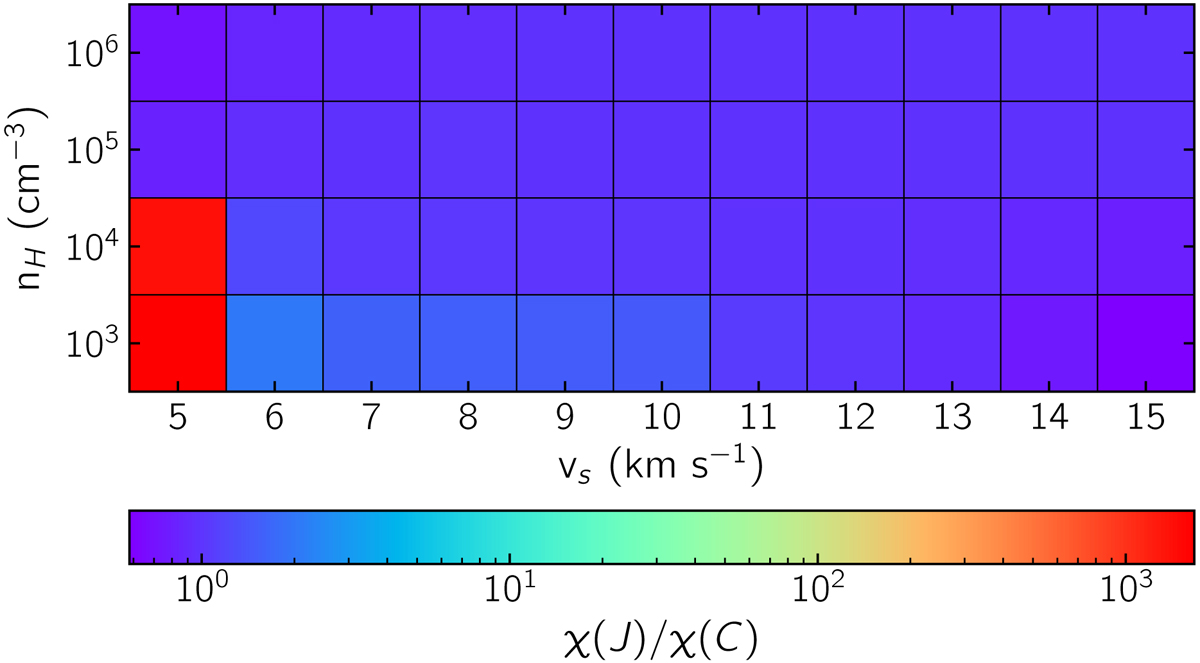
Ratio of the average J-type enhanced H2O abundance to the average C-type enhanced H2O abundance. The largest difference between average shock type abundance is at vs = 5 km s−1 and nH = 103 cm−3 and nH = 104 cm−3 where the ratio exceeds 1000.
Current usage metrics show cumulative count of Article Views (full-text article views including HTML views, PDF and ePub downloads, according to the available data) and Abstracts Views on Vision4Press platform.
Data correspond to usage on the plateform after 2015. The current usage metrics is available 48-96 hours after online publication and is updated daily on week days.
Initial download of the metrics may take a while.