Fig. 3
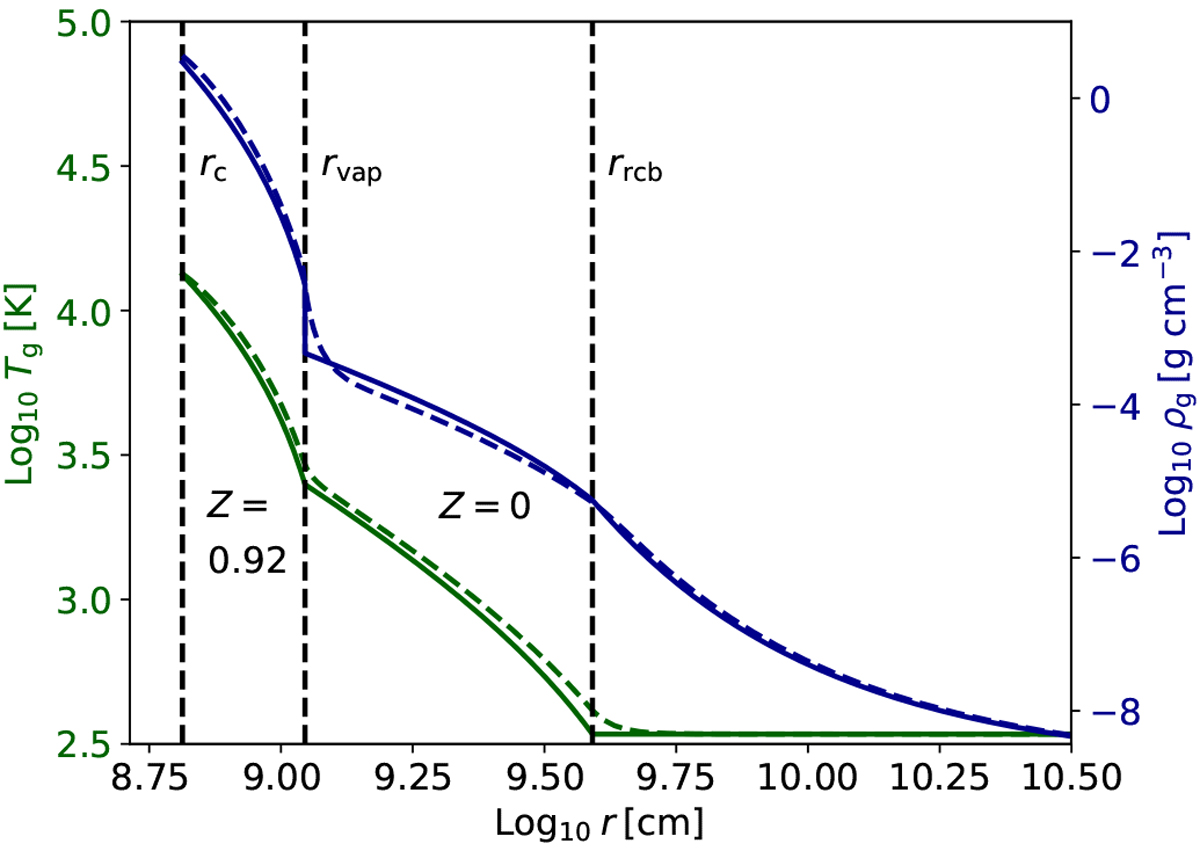
Envelope profiles of temperature (green) and density (blue) curves of an Earth-mass planet with Mc = 0.62 M⊕ at 1 AU. The dashed curves are obtained numerically from the structure equations, whereas the solid curves indicate our analytical model, plotted with the default parameters of Table 1. In our analytical model, the entropy and density change as a step-function at rvap, while the temperature and pressure remain continuous.
Current usage metrics show cumulative count of Article Views (full-text article views including HTML views, PDF and ePub downloads, according to the available data) and Abstracts Views on Vision4Press platform.
Data correspond to usage on the plateform after 2015. The current usage metrics is available 48-96 hours after online publication and is updated daily on week days.
Initial download of the metrics may take a while.