Fig. 9
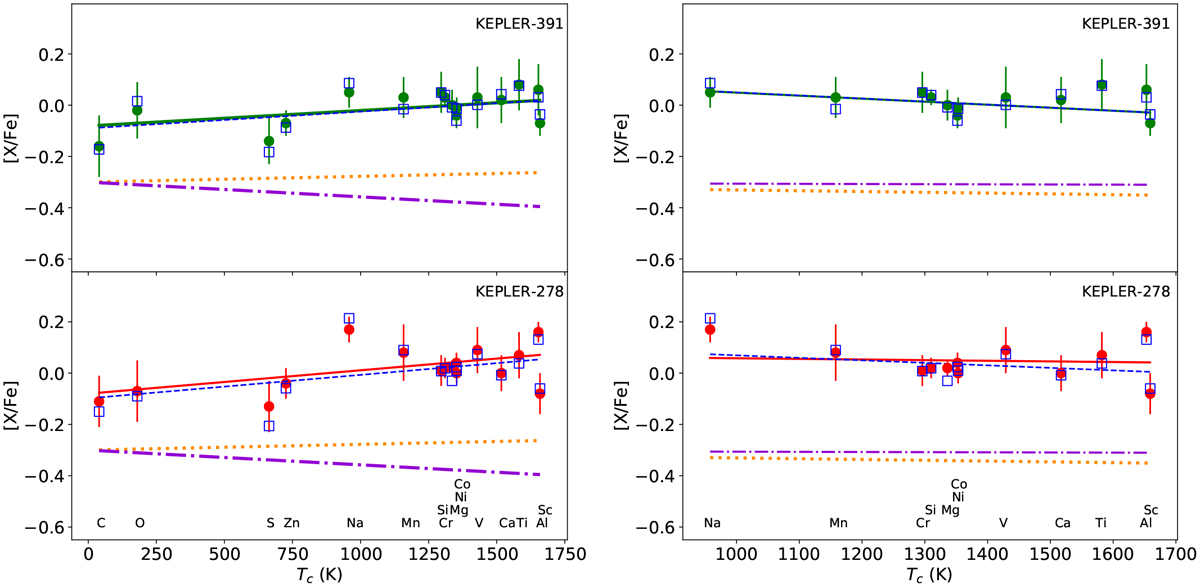
Left: abundances of volatile and refractory elements for Kepler-278 (bottom) and Kepler-391 (top) as a function of dust condensation temperature; filled circles and blue squares represent [X/Fe] without and with Galactic chemical evolution (GCE) corrections, respectively. Solid and dashed lines show the weighted linear fits to the abundance values without andwith GCE corrections, respectively. Orange dotted and purple dot-dashed lines show the mean trend found by M16 for subgiants and giants with planets, respectively. Right: same as left panel, but for refractory elements only.
Current usage metrics show cumulative count of Article Views (full-text article views including HTML views, PDF and ePub downloads, according to the available data) and Abstracts Views on Vision4Press platform.
Data correspond to usage on the plateform after 2015. The current usage metrics is available 48-96 hours after online publication and is updated daily on week days.
Initial download of the metrics may take a while.