Fig. 4
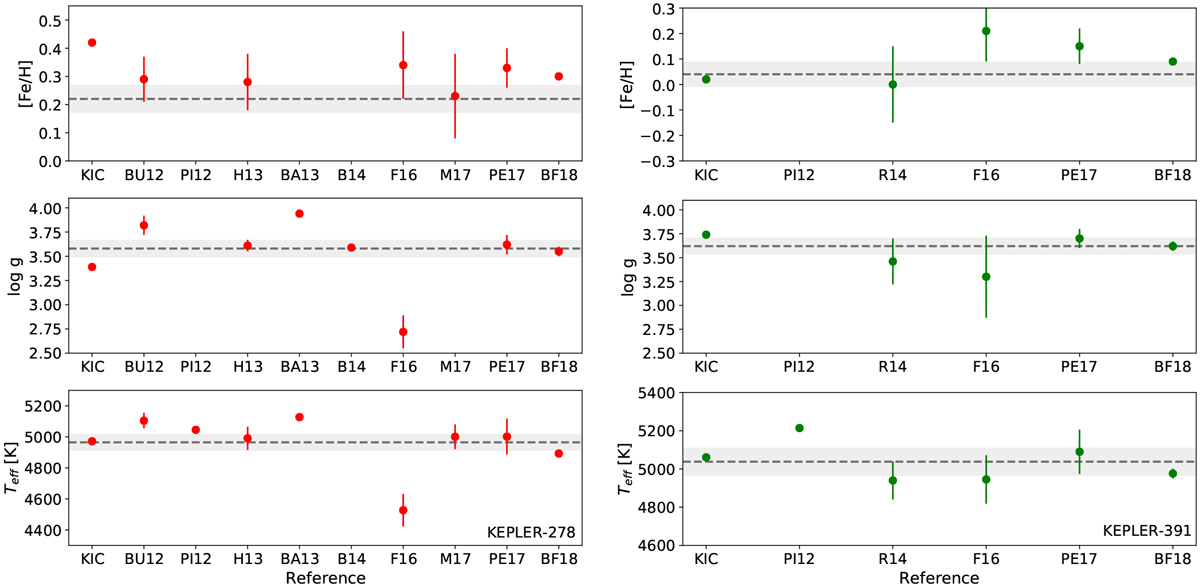
Comparison of our spectroscopic Teff, log g, and [Fe/H] values (dashed lines) for Kepler-278 (left) and Kepler-391 (right) with those reported by the Kepler Input Catalogue (Kepler Mission Team 2009, KIC), Buchhave et al. (2012, BU12), Pinsonneault et al. (2012, PI12), Huber et al. (2013, H13), Batalha et al. (2013, BA13), Rowe et al. (2014, R14), Bastien et al. (2014), Frasca et al. (2016, F16), Mathur et al. (2017, M17), Petigura et al. (2017, PE17), and Brewer & Fischer (2018, BF18). Grey shaded areas indicate the formal error in our results as detailed in Sect. 3.1.2.
Current usage metrics show cumulative count of Article Views (full-text article views including HTML views, PDF and ePub downloads, according to the available data) and Abstracts Views on Vision4Press platform.
Data correspond to usage on the plateform after 2015. The current usage metrics is available 48-96 hours after online publication and is updated daily on week days.
Initial download of the metrics may take a while.