Fig. B.2
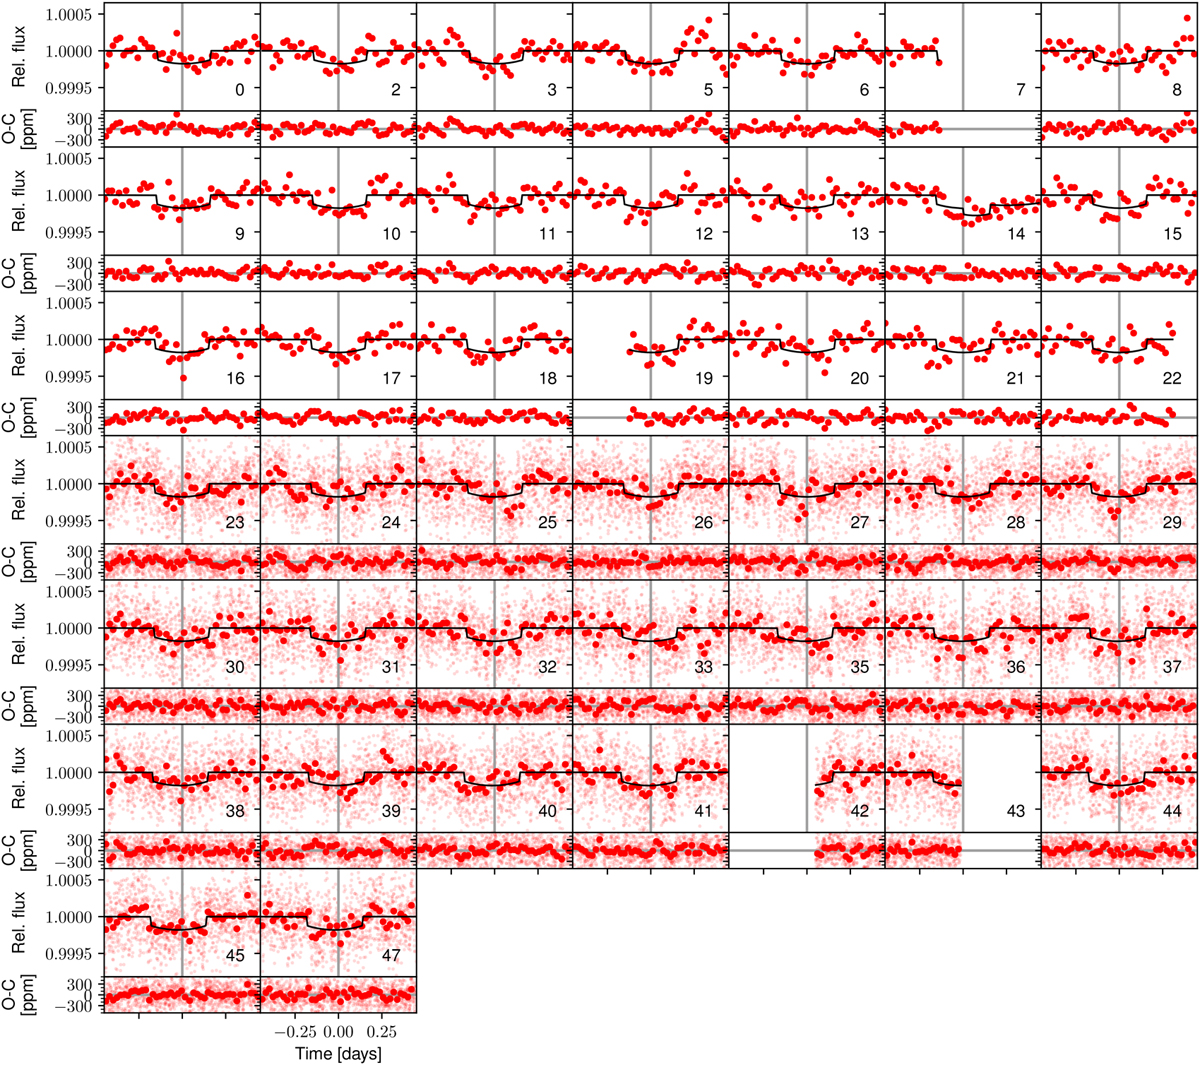
Transits of Kepler-278b observed by Kepler. Dots represent the individual short-cadence observations and larger circles are 30-min averaged values. In those panels without short-cadence points, the circles represent the long-cadence data. Each panel is labelled with the transit epoch, and centered relative to a linear ephemeris (indicated by the vertical grey lines). The model distribution is constructed from 1000 random MCMC steps. The black line denotes the median model. In the lower part of each panel the residuals after subtracting the model to the observed data are shown.
Current usage metrics show cumulative count of Article Views (full-text article views including HTML views, PDF and ePub downloads, according to the available data) and Abstracts Views on Vision4Press platform.
Data correspond to usage on the plateform after 2015. The current usage metrics is available 48-96 hours after online publication and is updated daily on week days.
Initial download of the metrics may take a while.