Fig. 13
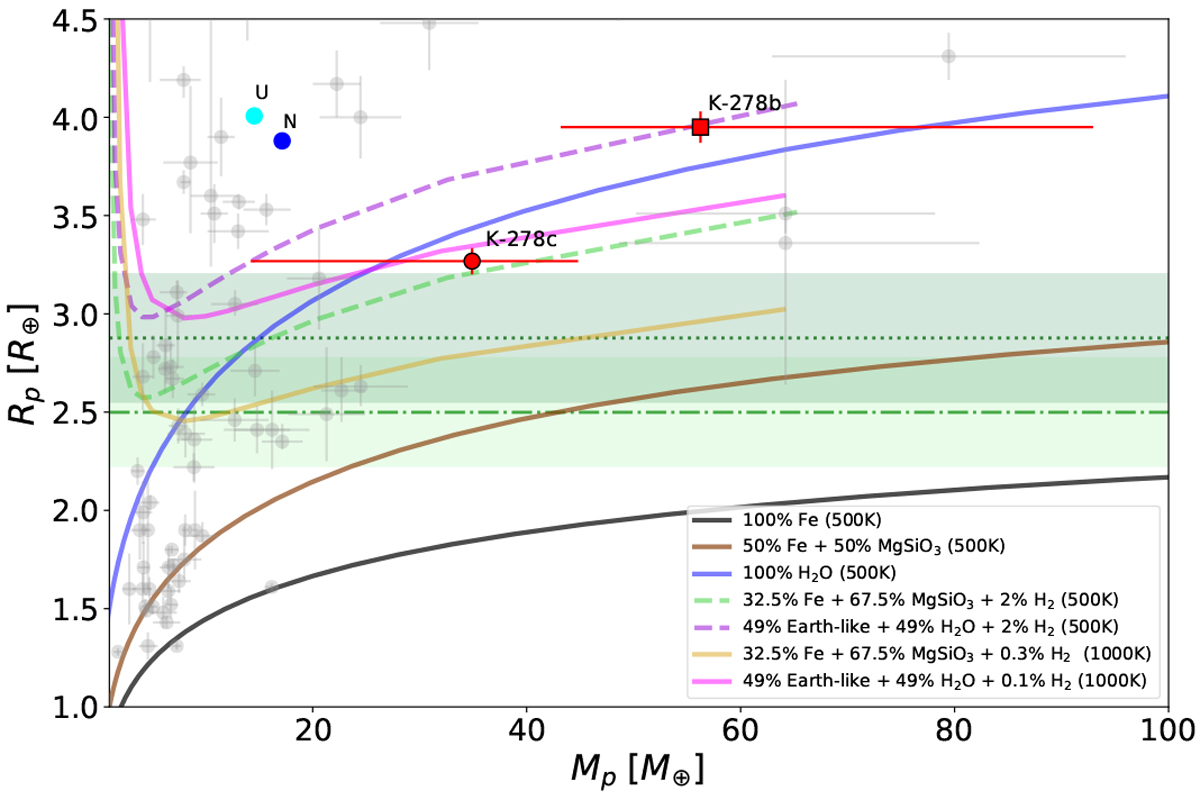
Mass–radius diagram for all confirmed planets with masses between 1–100 M⊕ and radii 1–4.5 R⊕ determined with a precision better than 30% (data taken from the NASA Exoplanet Archive on 2019 June 10). Theoretical composition models from Zeng et al. (2016) are displayed with different lines and colors. Kepler-278b and Kepler-278c are indicated with a red square and circle. Kepler-391b and Kepler-391c are indicated with dark and light green bands, respectively, that represent the 1σ uncertainty in our derived planetary radii. For reference, the solar system planets Uranus and Neptune are marked with a cyan and blue circle, respectively.
Current usage metrics show cumulative count of Article Views (full-text article views including HTML views, PDF and ePub downloads, according to the available data) and Abstracts Views on Vision4Press platform.
Data correspond to usage on the plateform after 2015. The current usage metrics is available 48-96 hours after online publication and is updated daily on week days.
Initial download of the metrics may take a while.