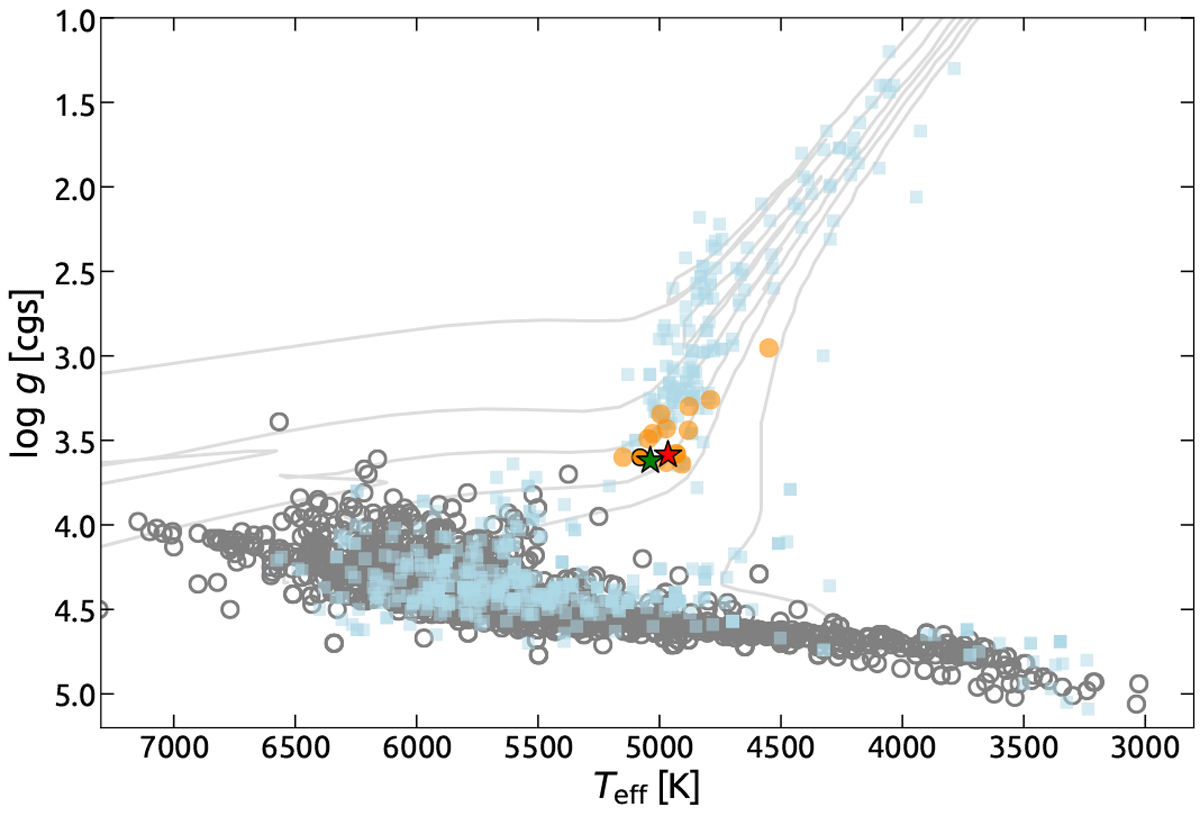
Fig. 12
Location of Kepler-278 (red star) and Kepler-391 (green star) in the HR diagram, based on the spectroscopic Teff and log g measured in this work, in comparison with other confirmed exoplanet hosts (taken from the NASA Exoplanet Archive on 2019 March 19; Akeson et al. 2013): light blue squares represent stars with confirmed planets detected via RVs, dark gray circles are stars with planets found by transits, and orange circles represent the small population of RGB stars with transiting planets. The star TOI-197, with values taken from Huber et al. (2019), is indicated by an orange circle with black edge-color. Error bars are omitted for clarity. Evolutionary tracks, corresponding to masses of 3, 2, 1.6, 1.3, 1.0, and 0.6 M⊙ (left to right) for [Fe/H] = +0.0 dex, from Girardi et al. (2000) are overplotted with continuous lines.
Current usage metrics show cumulative count of Article Views (full-text article views including HTML views, PDF and ePub downloads, according to the available data) and Abstracts Views on Vision4Press platform.
Data correspond to usage on the plateform after 2015. The current usage metrics is available 48-96 hours after online publication and is updated daily on week days.
Initial download of the metrics may take a while.