Fig. 8
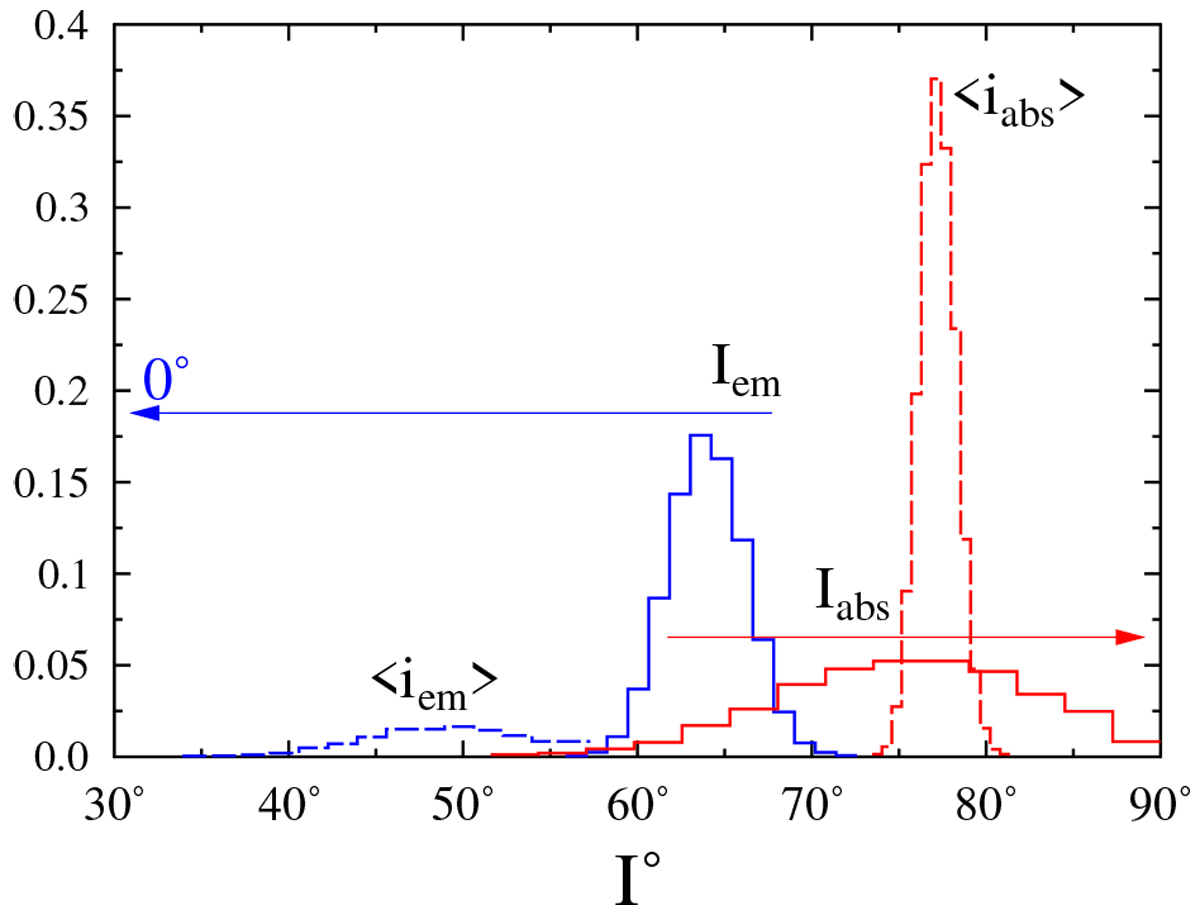
Full lines: histograms of Monte Carlo simulations for limit inclinations Iem,abs defined in Eq. (1). Dashed lines: histograms of average angles ⟨iem,abs⟩ defined in Eq. (2). Blue indicates stars with sBD in emission, red indicates sBD in absorption. The arrows indicate the domains over which the integrations that define ⟨iem,abs⟩ were performed, respectively.
Current usage metrics show cumulative count of Article Views (full-text article views including HTML views, PDF and ePub downloads, according to the available data) and Abstracts Views on Vision4Press platform.
Data correspond to usage on the plateform after 2015. The current usage metrics is available 48-96 hours after online publication and is updated daily on week days.
Initial download of the metrics may take a while.