Fig. 19
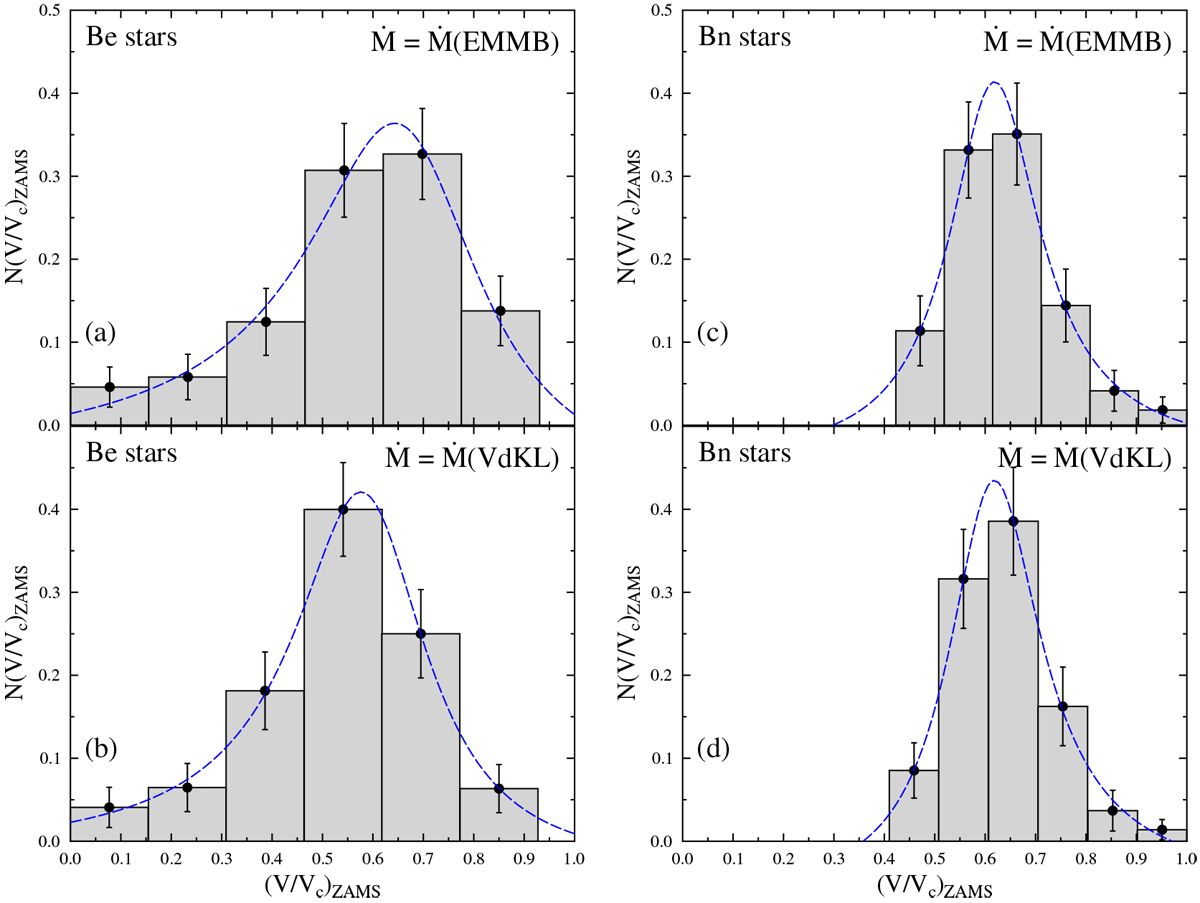
Normalized histograms showing the distribution of ratios V∕Vc in the ZAMS derived for the program Be (panels a and b) and Bn (panels c and d) stars. The results shown in panels a and c were obtained with EMMB mass-loss rates, while in panels b and dare for VdKL mass-loss rates. Error bars indicate sampling uncertainties according to the errors associated with the measured V sin i parameters. Fitted Person distributions are superimposed (blue dashed curves) to better perceive the differences in the asymmetries of distributions for each type of stars.
Current usage metrics show cumulative count of Article Views (full-text article views including HTML views, PDF and ePub downloads, according to the available data) and Abstracts Views on Vision4Press platform.
Data correspond to usage on the plateform after 2015. The current usage metrics is available 48-96 hours after online publication and is updated daily on week days.
Initial download of the metrics may take a while.