Fig. 18
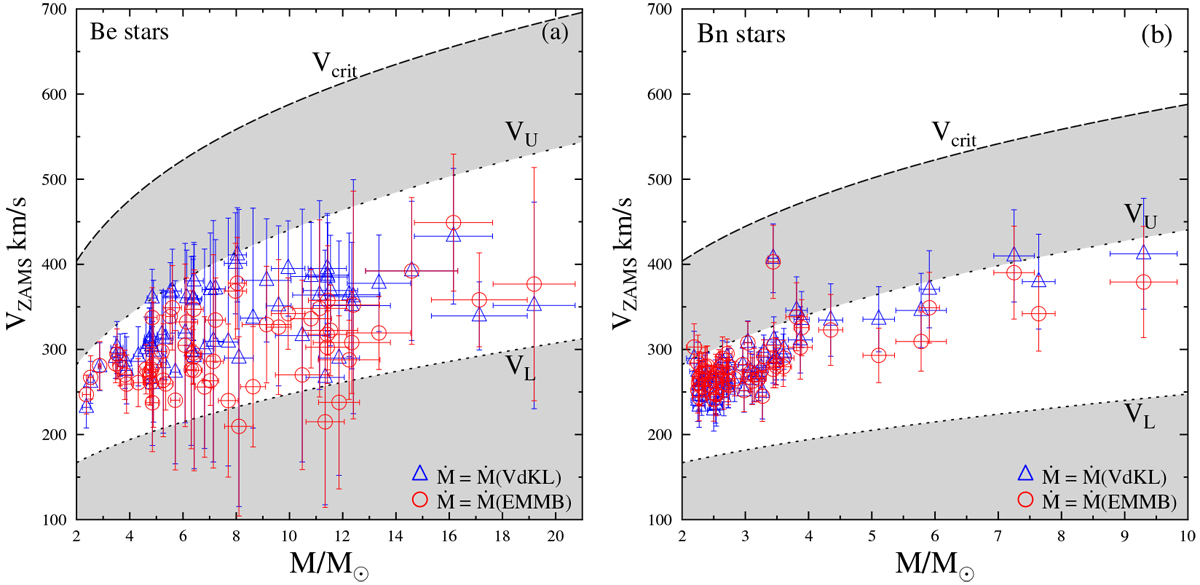
Equatorial rotational velocities VZAMS of Be (panel a) and Bn (panel b) stars deduced using models of stellar evolution by Ekström et al. (2008) with mass-loss rates Ṁ(EMMB) (red circles) and Ṁ(VdKL) (blue triangles). In the figure is shown the curve Vcrit in the ZAMS as a function of the stellar mass and the limiting curves VL and VU that surround the deduced VZAMS values.
Current usage metrics show cumulative count of Article Views (full-text article views including HTML views, PDF and ePub downloads, according to the available data) and Abstracts Views on Vision4Press platform.
Data correspond to usage on the plateform after 2015. The current usage metrics is available 48-96 hours after online publication and is updated daily on week days.
Initial download of the metrics may take a while.