Fig. 7.
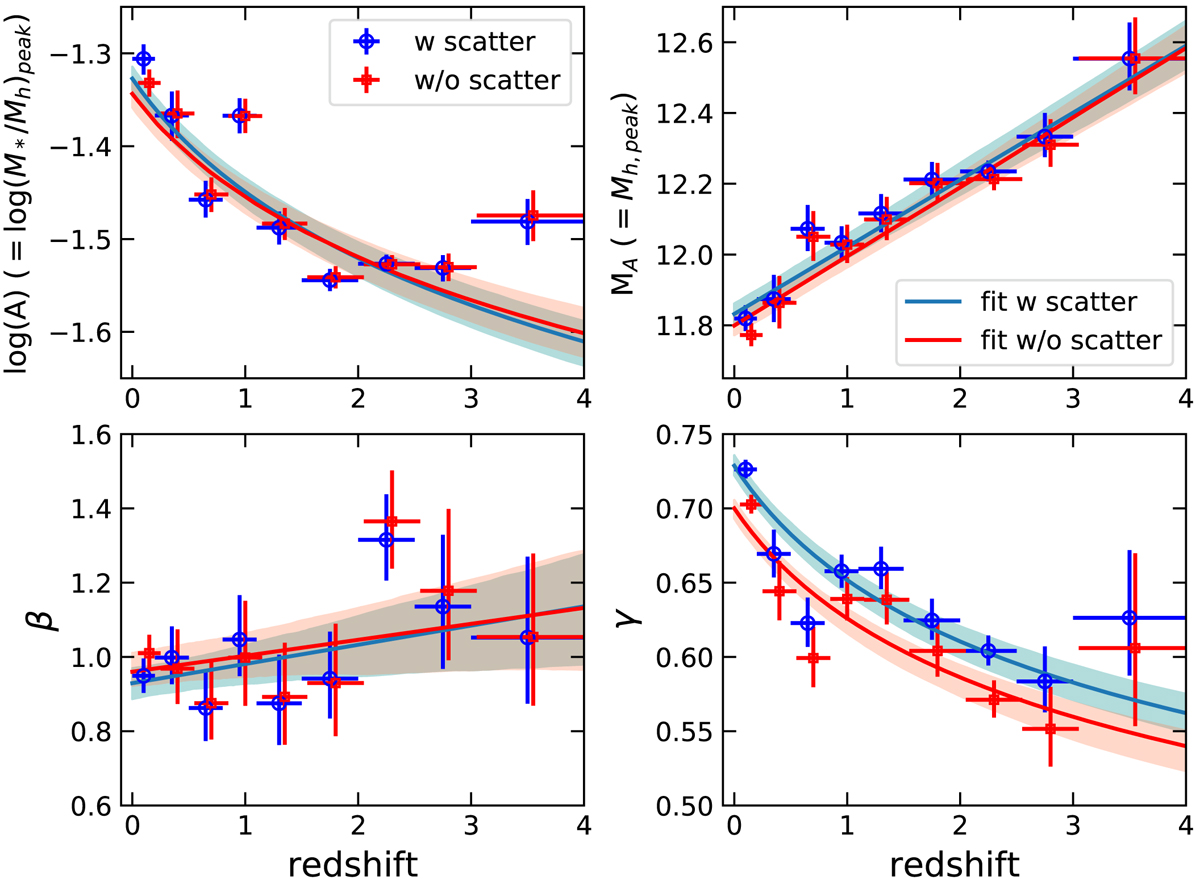
Evolution of the parameters MA, A, γ, and β (shown with points) for the case with and without relative scatter in blue and red, respectively. We also show the empirical best-fit model and the 1σ uncertainties (shown with lines and shaded areas, respectively) in blue and red for the case with and without scatter, respectively. Red points have been shifted by Δz = +0.05 to facilitate visual comparison.
Current usage metrics show cumulative count of Article Views (full-text article views including HTML views, PDF and ePub downloads, according to the available data) and Abstracts Views on Vision4Press platform.
Data correspond to usage on the plateform after 2015. The current usage metrics is available 48-96 hours after online publication and is updated daily on week days.
Initial download of the metrics may take a while.