Fig. 6.
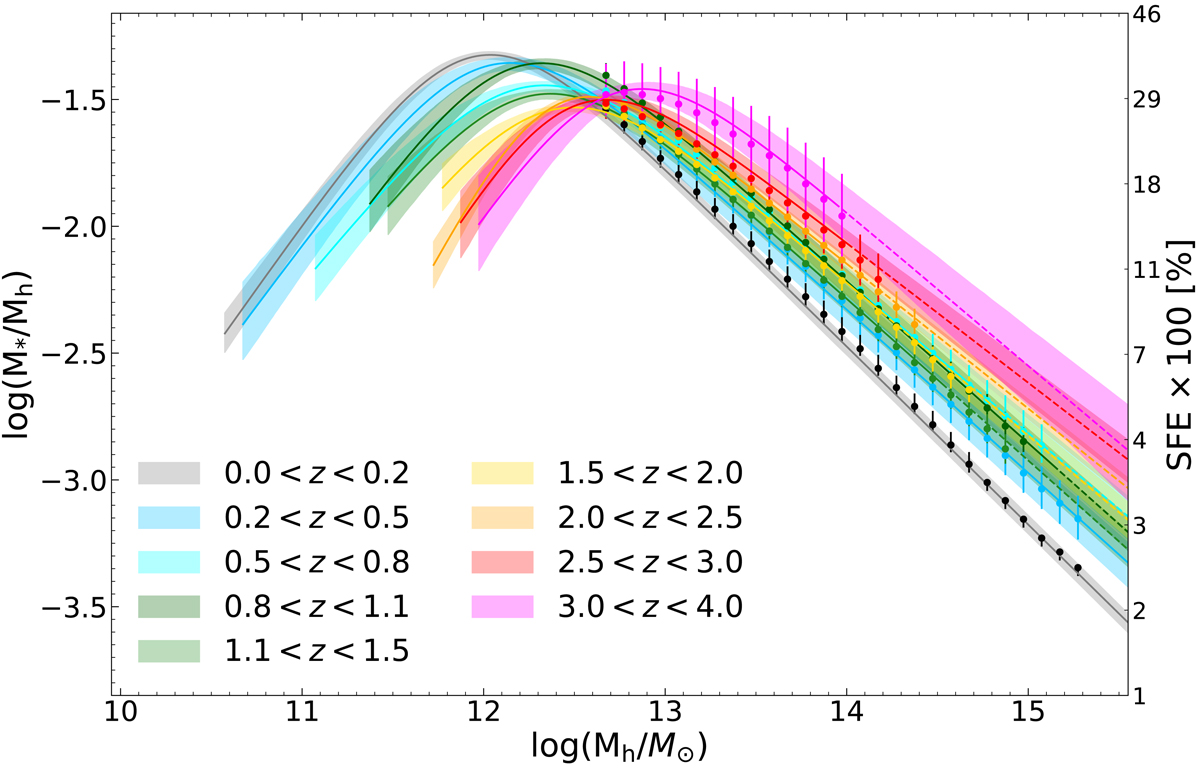
SHMR for our reference case without scatter derived in the log(M*/Mh)−log(Mh) plane. Points with error bars represent the observed relation obtained from the CMFs of the light cones (i.e., they represent the halo mass range of the ΛCDM DUSTGRAIN-pathfinder simulation), and the lines and corresponding shaded area represent the relation derived using the Despali et al. (2016) mass function and the 1σ error bar. The solid line identifies the observed mass range of galaxies, and the dashed line represents the extrapolation using the best-fit Schechter function. The right-hand side y-axis is labeled with the SFE expressed in percentage (defined as ![]() ).
).
Current usage metrics show cumulative count of Article Views (full-text article views including HTML views, PDF and ePub downloads, according to the available data) and Abstracts Views on Vision4Press platform.
Data correspond to usage on the plateform after 2015. The current usage metrics is available 48-96 hours after online publication and is updated daily on week days.
Initial download of the metrics may take a while.