Fig. 4.
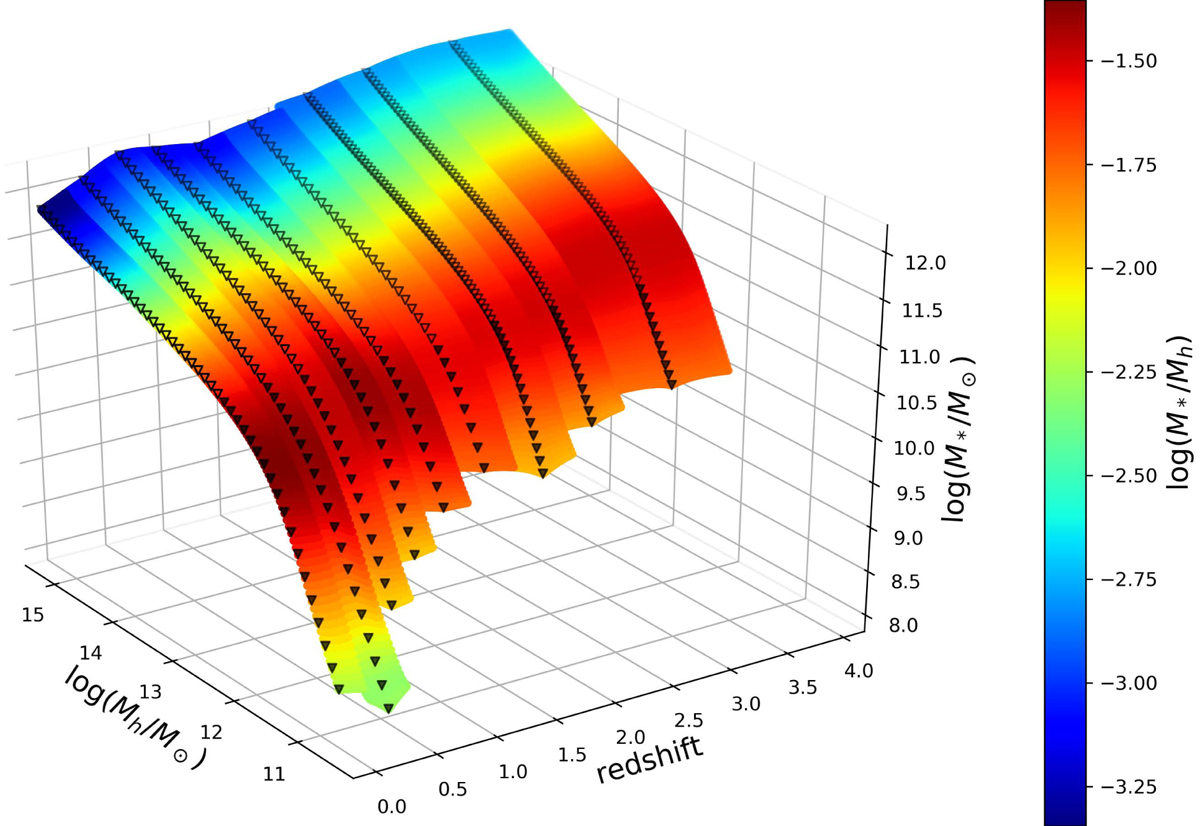
SHMR without scatter derived in the log(M*)−log(Mh) redshift plane, color-coded with log(M*/Mh). Points represent the observed relation derived from the CMFs. Open points show the halo mass range of the simulation (i.e., log(Mh/M⊙) ≥ 12.5), and open and solid points indicate the halo mass range we used to derive the SHMR with the Despali et al. (2016) HMF. The colored layer is a linear interpolation between observed data points and is color-coded for the value of log(M*/Mh). The lower limit in mass is given by the observed SMFs.
Current usage metrics show cumulative count of Article Views (full-text article views including HTML views, PDF and ePub downloads, according to the available data) and Abstracts Views on Vision4Press platform.
Data correspond to usage on the plateform after 2015. The current usage metrics is available 48-96 hours after online publication and is updated daily on week days.
Initial download of the metrics may take a while.