Fig. 3.
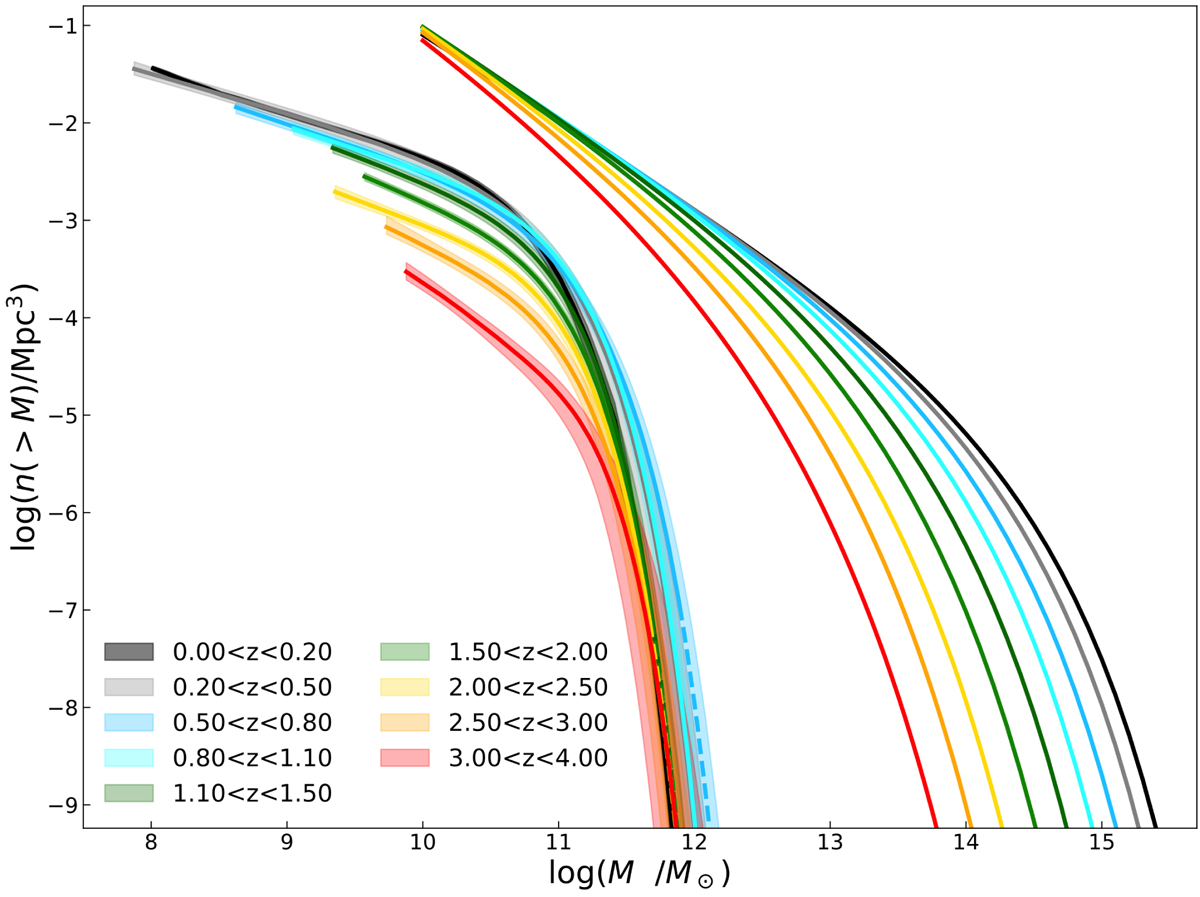
CMFs used in the (sub-) halo abundance matching in different redshift bins. On the left, solid and dashed lines with shaded area represent the SMF with 1σ uncertainty (best fit to 1/Vmax points; with the exception of the redshift bin 0.0 < z < 0.2, the best fits have been corrected for the Eddington bias) cumulated as described in Sect. 4.1. Solid lines represent the SMF up to the last 1/Vmax point, and dashed lines show this at higher masses. On the right, the solid lines are the Despali et al. (2016) CMFs we used to evaluate the SHMR.
Current usage metrics show cumulative count of Article Views (full-text article views including HTML views, PDF and ePub downloads, according to the available data) and Abstracts Views on Vision4Press platform.
Data correspond to usage on the plateform after 2015. The current usage metrics is available 48-96 hours after online publication and is updated daily on week days.
Initial download of the metrics may take a while.