Fig. 2.
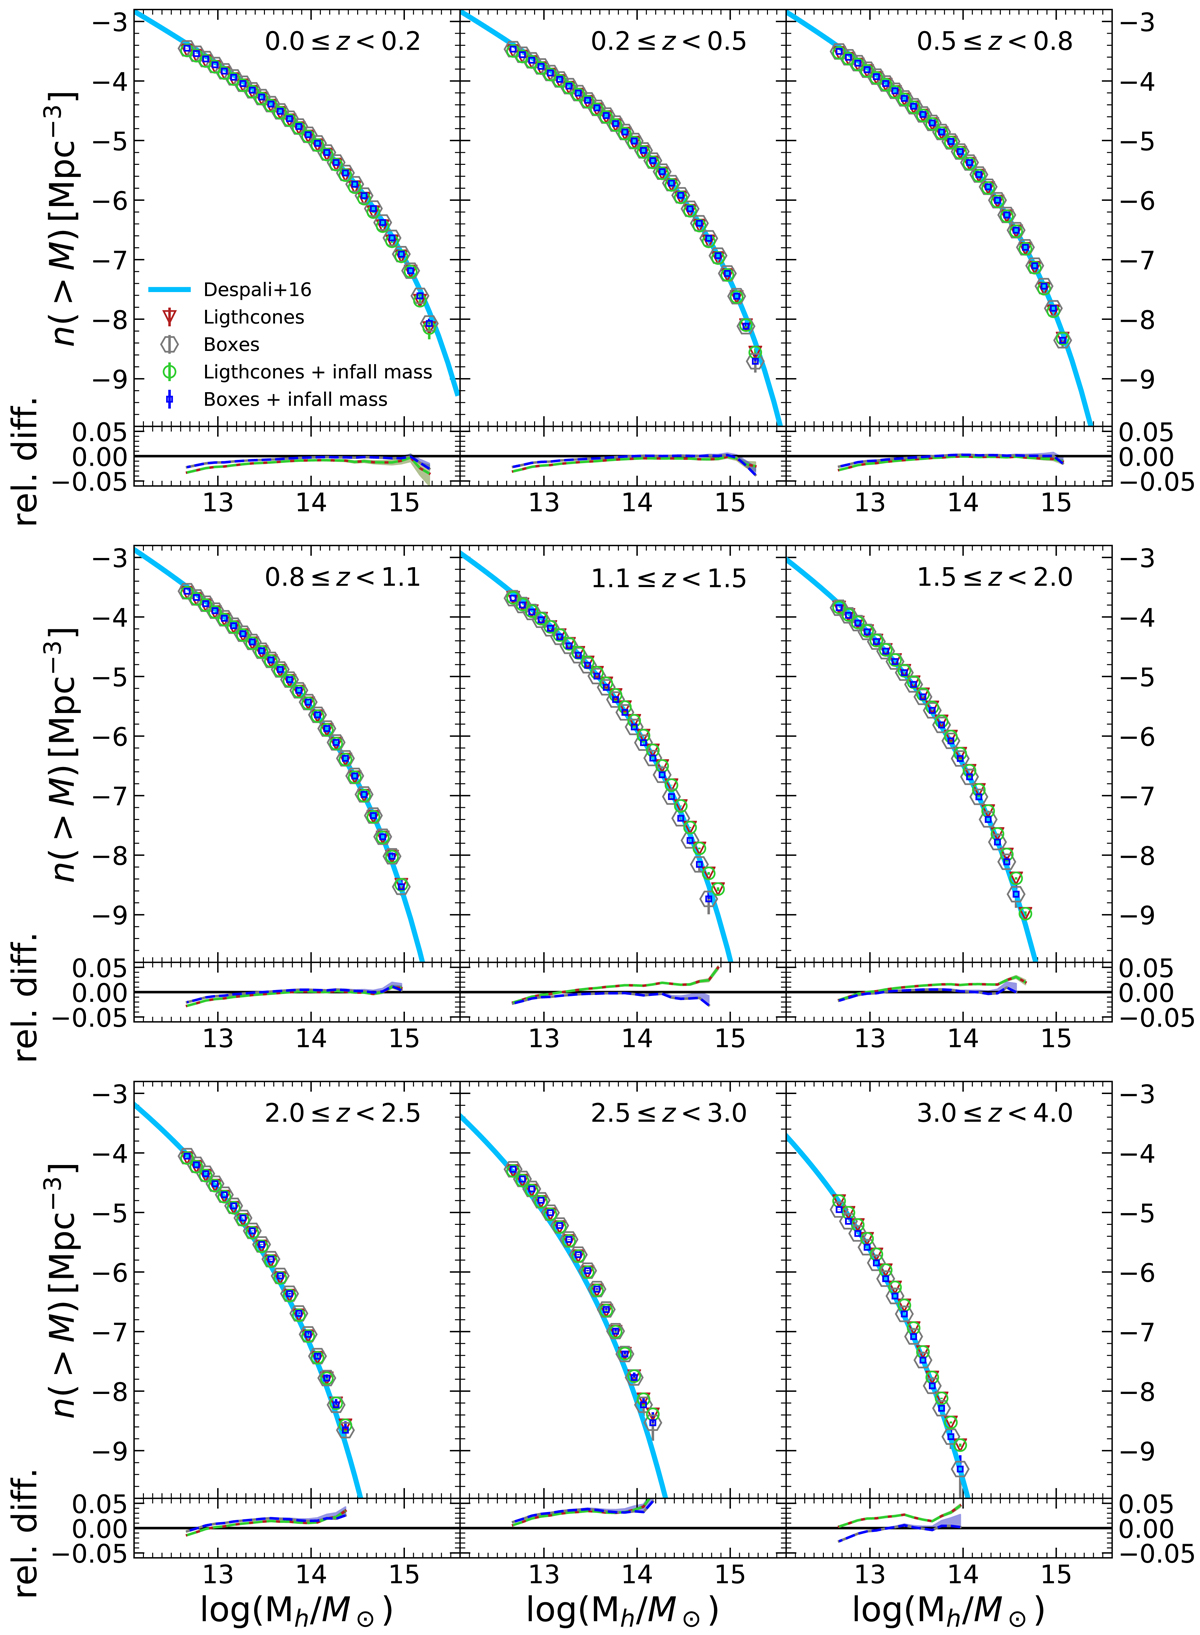
Cumulative halo mass functions in nine different redshift bins. The cyan line represents the Despali et al. (2016) halo mass function calculated at the center of the redshift bin. The colored points represent the halo mass function of the ΛCDM DUSTGRAIN-pathfinder simulation: red triangles are the halo CMF evaluated on the ligth cones without taking the infall mass for the subhalos into account, green circles make use of the infall mass, gray hexagons represent the halo CMF using comoving boxes without using the infall mass for the subhalos, and blue squares are derived from simulation boxes taking the infall mass into account. Bottom panels: relative difference of the CMF of the simulation with respect to the Despali et al. (2016) mass function.
Current usage metrics show cumulative count of Article Views (full-text article views including HTML views, PDF and ePub downloads, according to the available data) and Abstracts Views on Vision4Press platform.
Data correspond to usage on the plateform after 2015. The current usage metrics is available 48-96 hours after online publication and is updated daily on week days.
Initial download of the metrics may take a while.