Fig. 13.
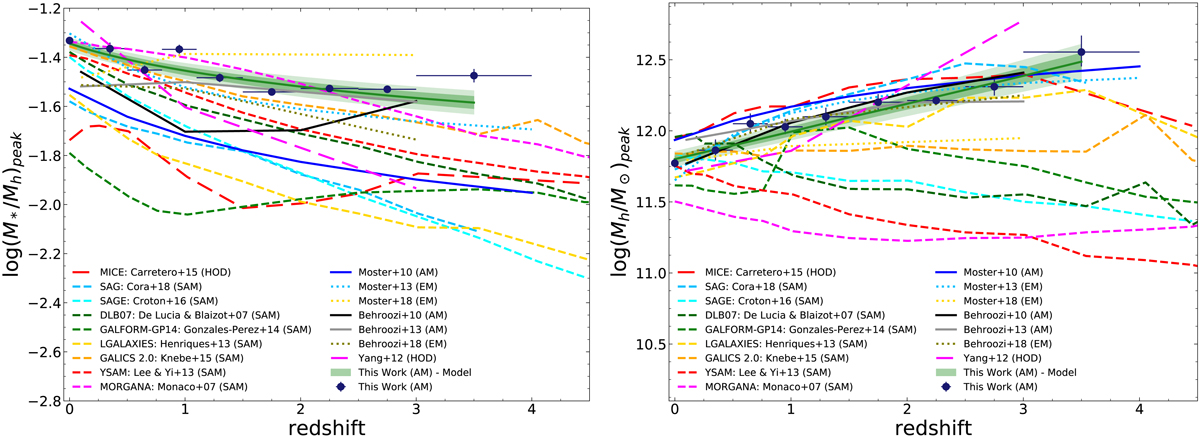
Left: evolution of the peak of the SHMR (for our reference case) compared with previous literature works and results of SAMs of galaxy formation and evolution. Dark blue points and error bars represent the fit of our measured SHMR. The model we propose is shown in green, along with 1 and 2σ errors estimated on the posterior distribution of the free parameters of the fit. Right: comparison of the evolution of the halo mass at the peak of the SHMR (for our reference case). Symbols are the same as in the other panel.
Current usage metrics show cumulative count of Article Views (full-text article views including HTML views, PDF and ePub downloads, according to the available data) and Abstracts Views on Vision4Press platform.
Data correspond to usage on the plateform after 2015. The current usage metrics is available 48-96 hours after online publication and is updated daily on week days.
Initial download of the metrics may take a while.