Fig. 12.
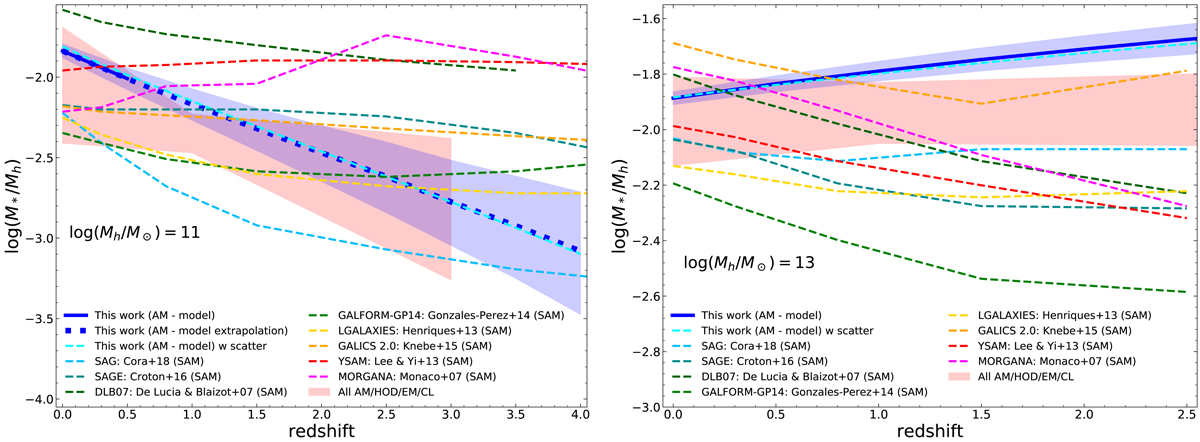
Evolution of the SHMR at fixed halo masses of log(Mh/M⊙) = 11.0 (left) and log(Mh/M⊙) = 13.0 (right). Our results derived from the model described in Sect. 5.2 are shown with a blue line, and the corresponding shaded area represents 1σ uncertainties for our reference case. Cyan dashed lines show our results with relative scatter (errors are not shown, but are comparable to the errors of the reference case). Solid lines indicate the observed mass range in the SMF, and the dotted line represents the range of masses extrapolated by the model. Dashed colored lines represent the eight SAMs of the Cosmic CARNage project. The evolution in the left panel is shown from z = 0 to z = 4, and the right panel only shows the evolution up to z = 2.5 because data at higher redshifts for these halo masses are lacking in the Cosmic CARNage simulations. Red shaded regions show the range covered by all the AM, HOD, EM, and CL results, as presented in Figs. 9 and 10 and described in Sect. 5.3 and Appendix A (without the results of this work). We note that not all the works in literature extend their results down to log(Mh/M⊙) = 11 or up to log(Mh/M⊙) = 13, and we therefore show only those whose results reach these masses.
Current usage metrics show cumulative count of Article Views (full-text article views including HTML views, PDF and ePub downloads, according to the available data) and Abstracts Views on Vision4Press platform.
Data correspond to usage on the plateform after 2015. The current usage metrics is available 48-96 hours after online publication and is updated daily on week days.
Initial download of the metrics may take a while.