Fig. 1.
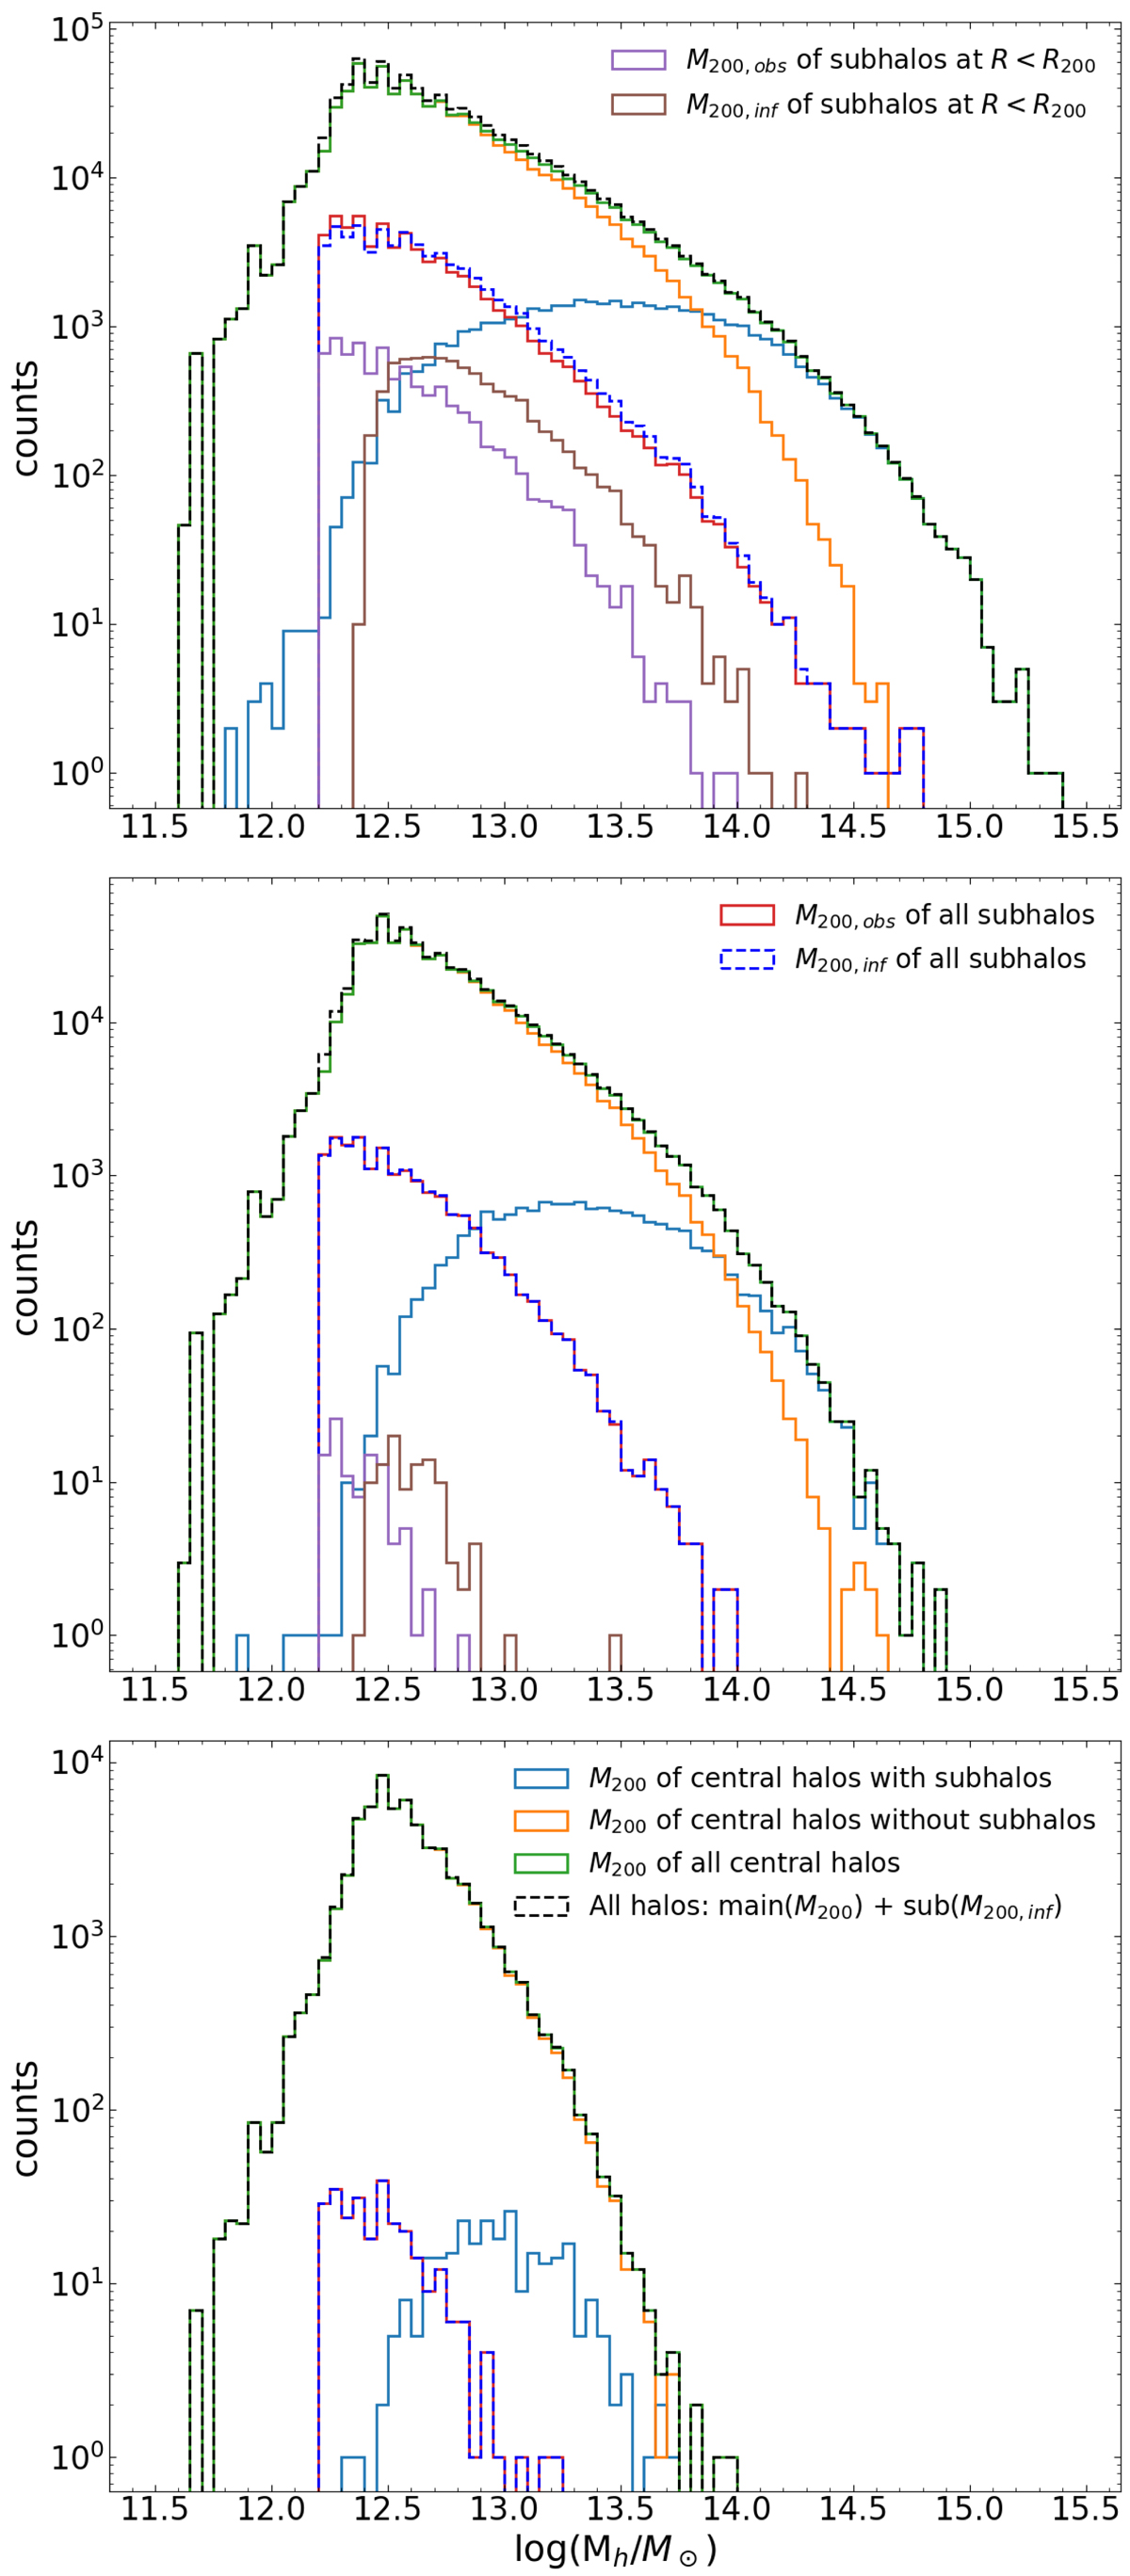
Histograms of halo masses for three comoving boxes located at z = 0 (top panel), z = 1 (central panel), and z = 3 (bottom panel). In all panels, we show the distribution of observed mass (violet) and infall mass (brown) of subhalos that have entered R200 of their main halo (i.e., are located at R < R200, main halo). We also show the distribution of observed (red) and infall (blue) masses of all subhalos and the mass distribution of main (or central) halos with subhalos (light blue), the distribution of main halos without subhalos (orange), the total distribution of all main halos (green), and the distribution of all halos (black; i.e., both main and subhalos) considering the infall mass for subhalos.
Current usage metrics show cumulative count of Article Views (full-text article views including HTML views, PDF and ePub downloads, according to the available data) and Abstracts Views on Vision4Press platform.
Data correspond to usage on the plateform after 2015. The current usage metrics is available 48-96 hours after online publication and is updated daily on week days.
Initial download of the metrics may take a while.