Fig. 2.
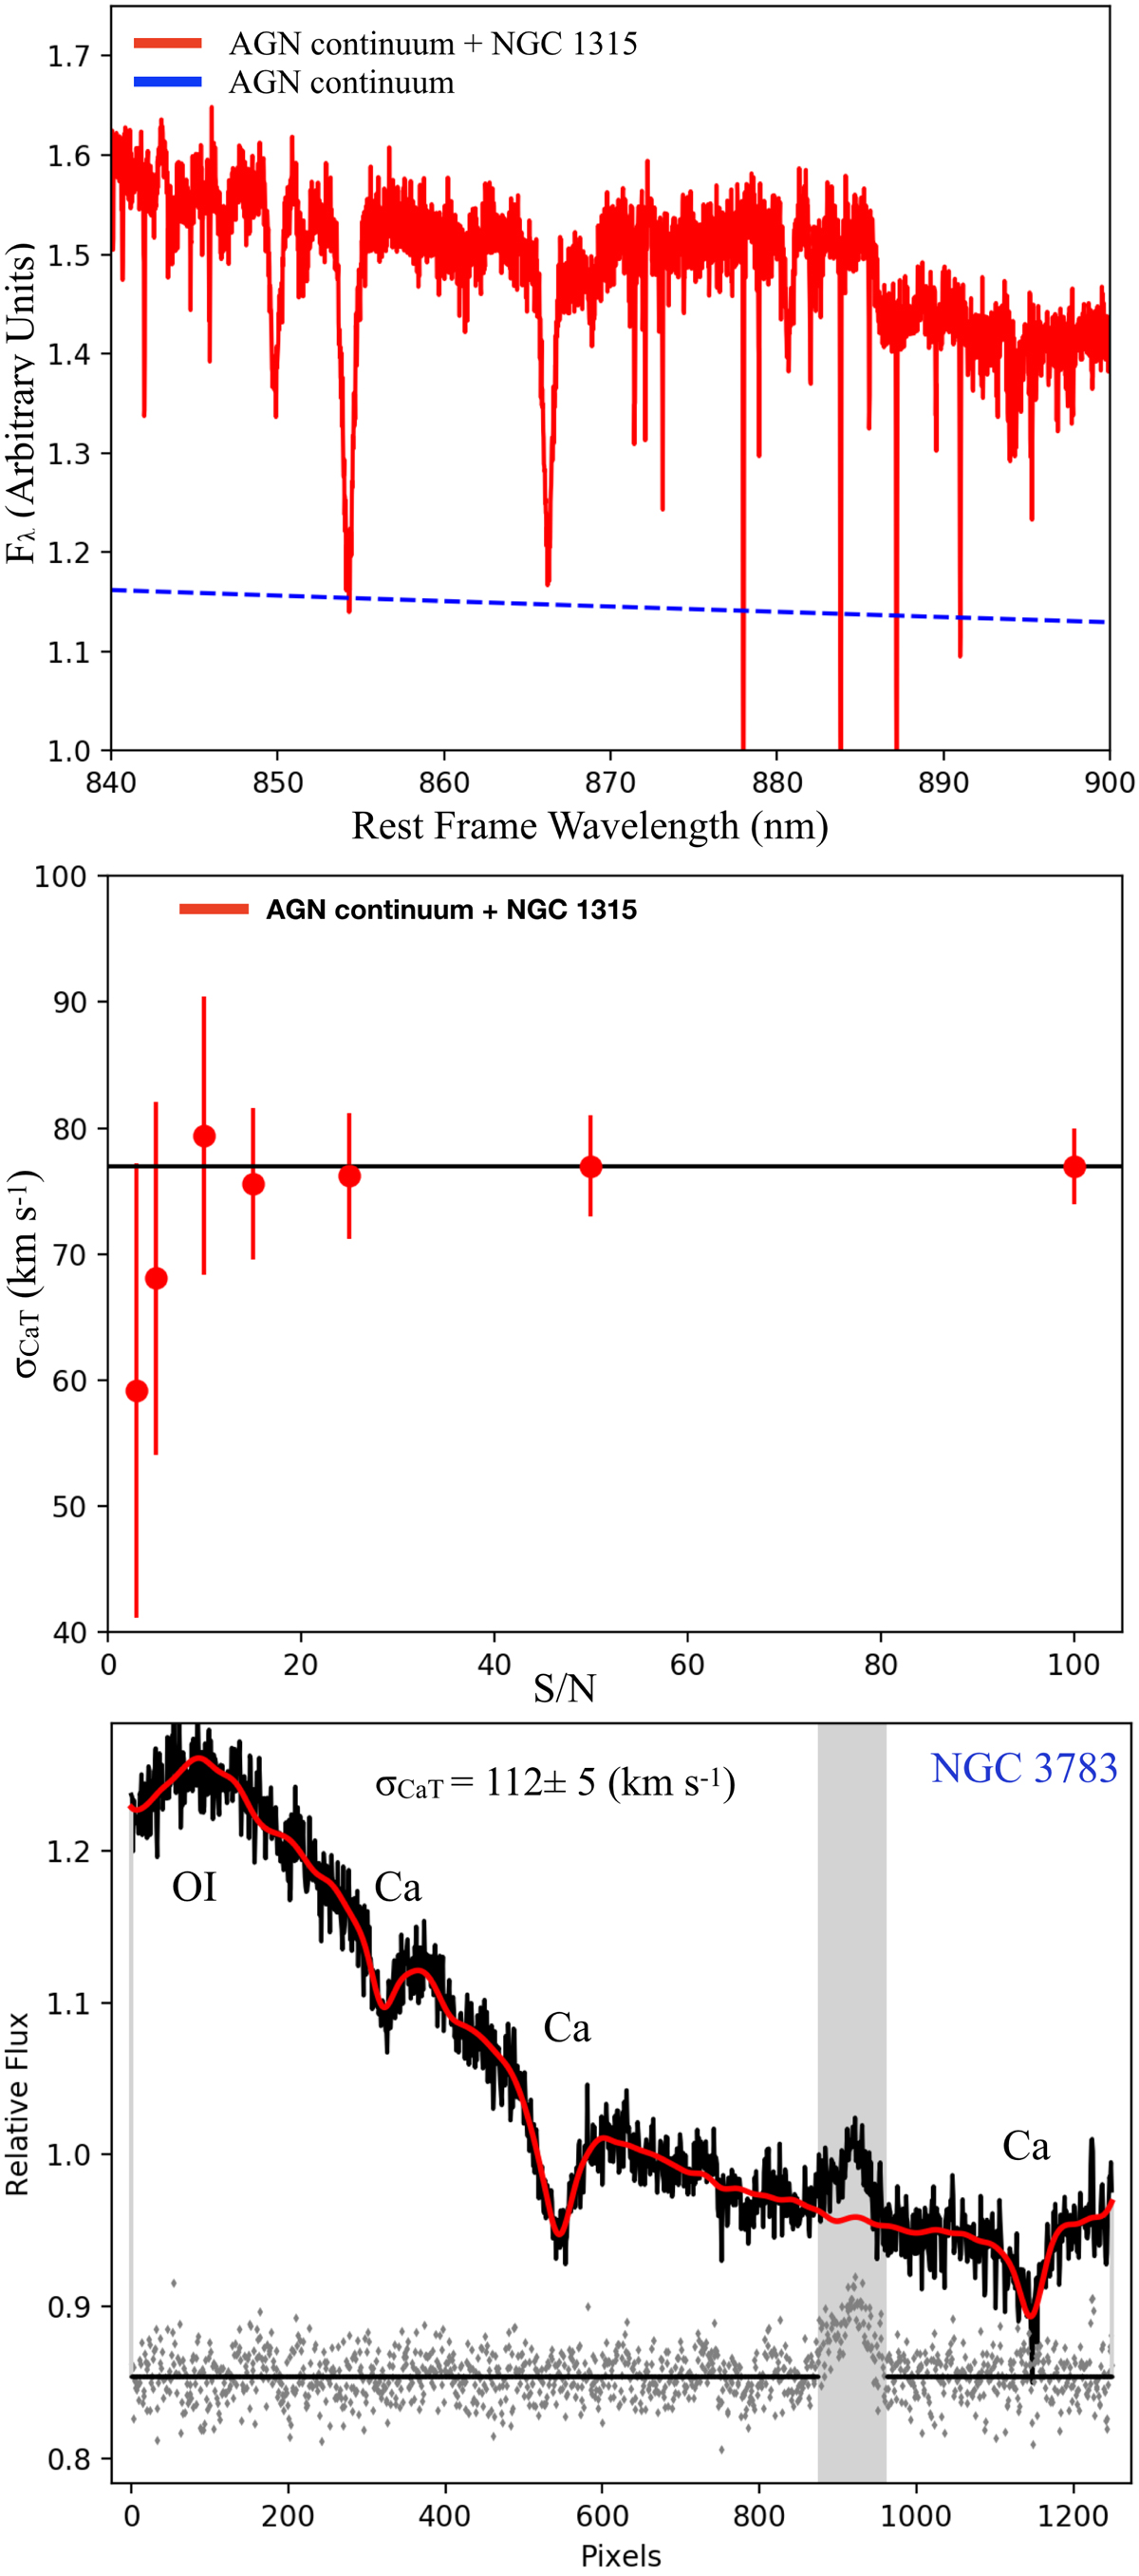
Top: example of the spectrum from the control galaxy NGC 1315, which is combined with the model AGN continuum. The assumed AGN continuum are presented as the red and the blue, respectively. Middle: stellar velocity dispersion estimates relative to the S/N of the AGN continuum for NGC 1315 (red). The solid black line represents the stellar velocity dispersion estimate from the X-shooter spectrum, which has a S/N ∼ 44 per pixel. Bottom: example of pPXF fit for NGC 3783. Position of the O I emission line and the CaT absorption lines are demonstrated in the plot for visual aid. The gray masked feature represents the Fe II emission line at 8616 Å.
Current usage metrics show cumulative count of Article Views (full-text article views including HTML views, PDF and ePub downloads, according to the available data) and Abstracts Views on Vision4Press platform.
Data correspond to usage on the plateform after 2015. The current usage metrics is available 48-96 hours after online publication and is updated daily on week days.
Initial download of the metrics may take a while.