Fig. 1.
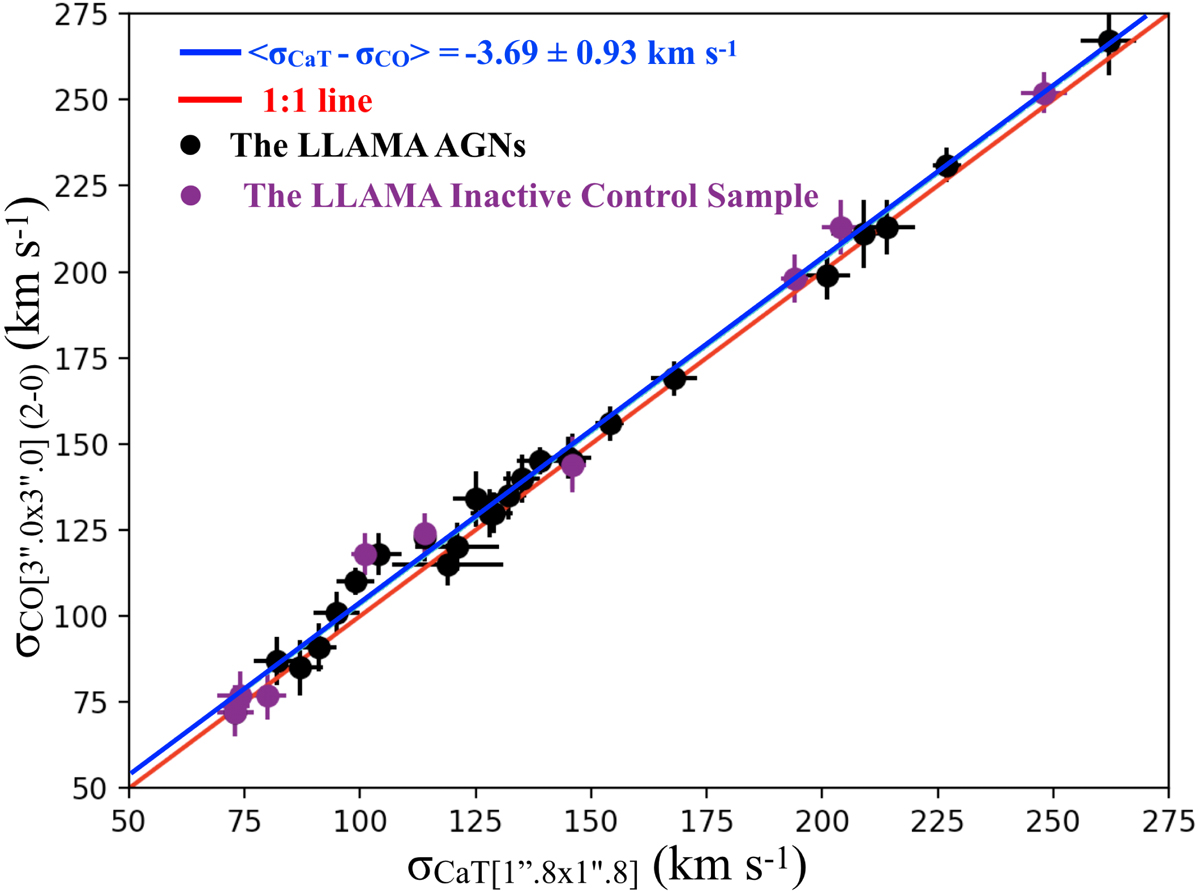
Stellar velocity dispersion results, which are calculated from the CaT and CO (2-0) absorption features. Some of sources are not still observed for our entire sample, therefore, the sources for which our sample includes both σCaT and σCO(2-0) estimates are compared. The red solid line represents 1:1 line, whereas the blue solid line shows the offset between the σCaT and σCO(2-0) estimates of our data. The LLAMA AGNs and inactive galaxies are presented as black and purple, respectively.
Current usage metrics show cumulative count of Article Views (full-text article views including HTML views, PDF and ePub downloads, according to the available data) and Abstracts Views on Vision4Press platform.
Data correspond to usage on the plateform after 2015. The current usage metrics is available 48-96 hours after online publication and is updated daily on week days.
Initial download of the metrics may take a while.