Fig. 9.
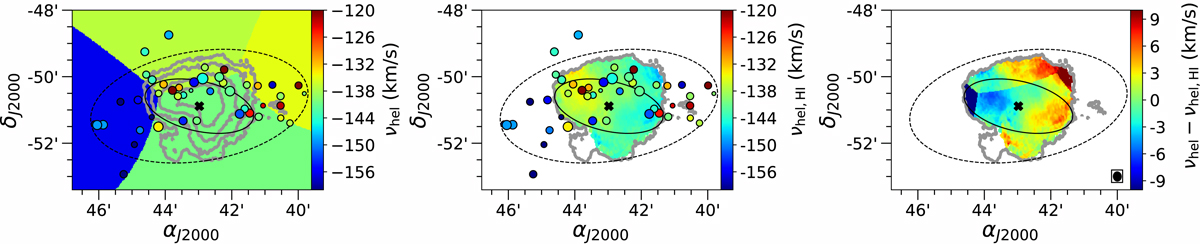
Comparison between the HI (Iorio et al. 2017) and stellar (this work) velocity field. Left: Voronoi-binned stellar velocity field (S/N ∼ 3, see text for details); the gray contours show the HI surface density at 0.6, 1.2, 1.8, 2.4 M⊙ pc−2, with the lowest contour at 3σ above the noise (also shown in the middle and right panels). Middle: HI velocity field. Right: pixel-to-pixel difference between the stellar and HI velocity field; the small ellipse in the bottom right corner shows the beam of the HI observations. In the first two panels the circles represent the stars in our sample; the color indicates the vhel, and the size is proportional to vhel/δ vhel. In each panel the dashed ellipse is the same as Fig. 1, while the solid ellipse shows the PA and the inclination obtained through the analysis of the HI kinematics disk by Iorio et al. (2017). The cross indicates the galactic center (see Table 1).
Current usage metrics show cumulative count of Article Views (full-text article views including HTML views, PDF and ePub downloads, according to the available data) and Abstracts Views on Vision4Press platform.
Data correspond to usage on the plateform after 2015. The current usage metrics is available 48-96 hours after online publication and is updated daily on week days.
Initial download of the metrics may take a while.