Fig. 8.
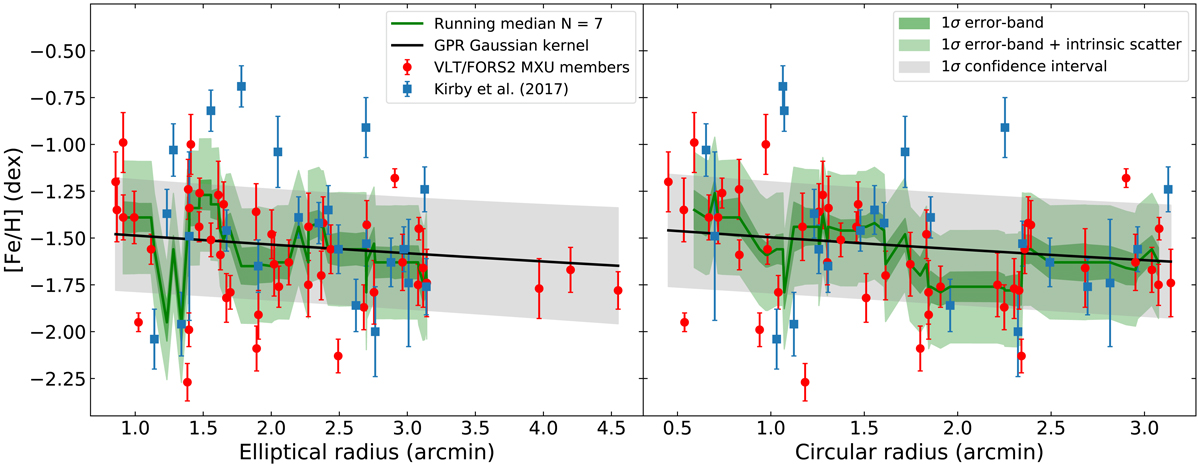
[Fe/H] as a function of the elliptical radius (left) and circular radius (right) for Aquarius member stars observed with FORS2 (red circles) and with DEIMOS (blue squares; Kirby et al. 2017a). The error bars show the uncertainties on the [Fe/H] measurements for the individual stars. The solid green line represents a running median boxcar with a kernel size of 7 points; the green band shows the 1σ error for the running median boxcar, taken as the standard deviation of 1000 Monte Carlo realizations of the running median itself, where the metallicities are extracted from Gaussians centered on the measured [Fe/H] of each star and dispersion given by the measurement uncertainty; the light green band is the same error band with the MDF intrinsic scatter added in quadrature. The black solid line represents the result of a Gaussian process regression analysis using a Gaussian kernel and taking into account an intrinsic scatter; the gray band indicates the corresponding 1σ confidence interval.
Current usage metrics show cumulative count of Article Views (full-text article views including HTML views, PDF and ePub downloads, according to the available data) and Abstracts Views on Vision4Press platform.
Data correspond to usage on the plateform after 2015. The current usage metrics is available 48-96 hours after online publication and is updated daily on week days.
Initial download of the metrics may take a while.