Fig. 6.
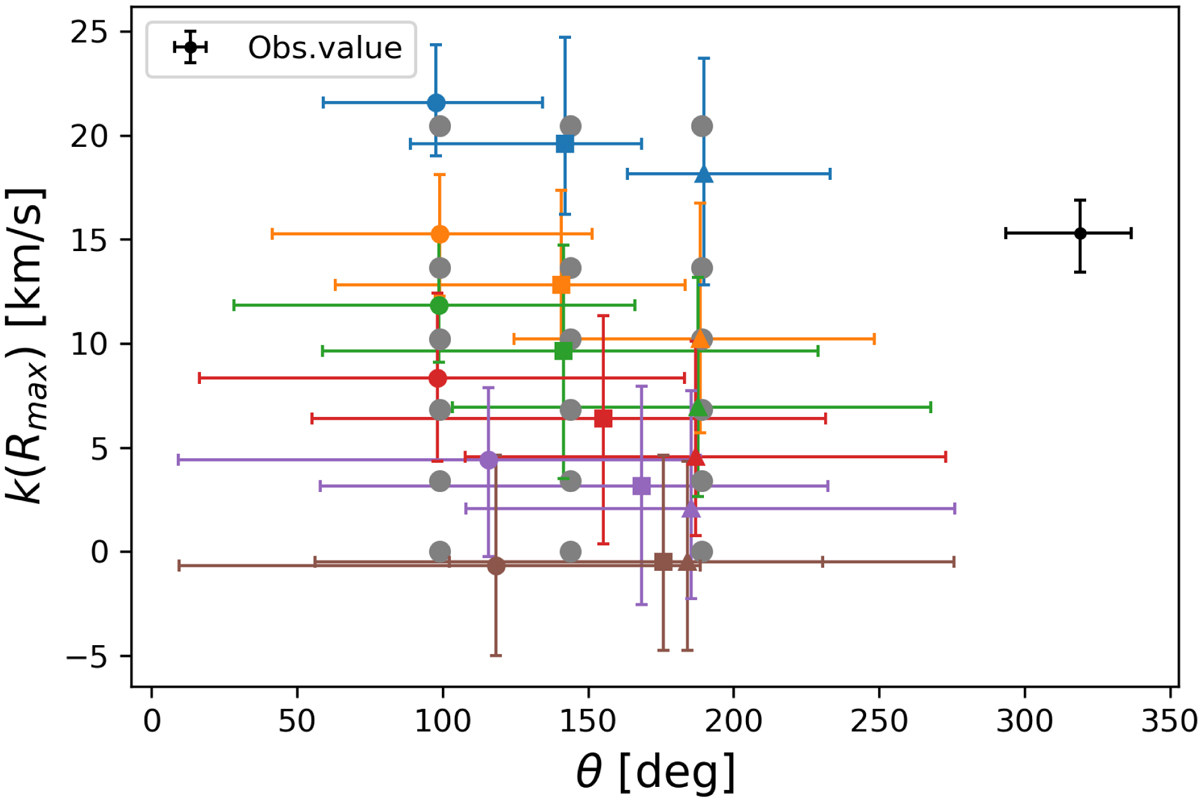
Rotation velocity at Rmax = 3′ vs. kinematic position angle recovered from the tests on mock catalogues reproducing the characteristics of the FORS2 data set and simulating a linear rotation model. Gray circles represent input values at n = 1.5, 1.0, 0.75, 0.5, 0.25, 0.; colored circles, squares, and triangles represent recovered values at different simulated kinematic PA; colors from blue to brown represent decreasing values of n, while the error bars are the 99% confidence interval (C.I.); in black the observed value from our data set with error bars at 68% C.I.
Current usage metrics show cumulative count of Article Views (full-text article views including HTML views, PDF and ePub downloads, according to the available data) and Abstracts Views on Vision4Press platform.
Data correspond to usage on the plateform after 2015. The current usage metrics is available 48-96 hours after online publication and is updated daily on week days.
Initial download of the metrics may take a while.