Fig. 1.
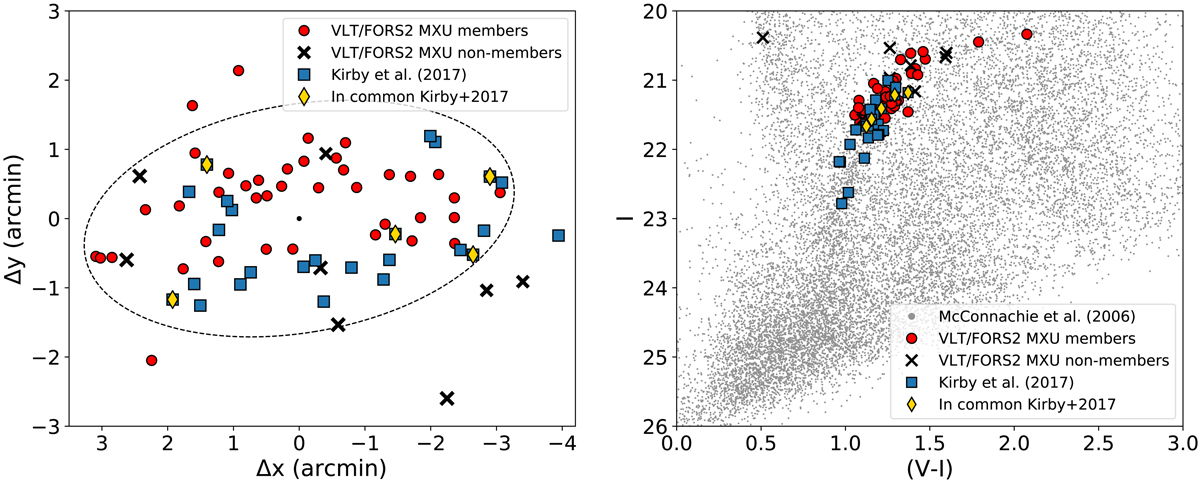
Spatial distribution (left) of the targets projected onto the tangential plane and color-magnitude diagram of the stars along the line of sight to Aquarius (right). Shown are the stars observed with VLT/FORS2 MXU and classified as Aquarius members (red circles), the sample of stars members from Kirby et al. (2017a) (blue squares), the stars in common between these two studies (yellow diamonds), and the VLT/FORS2 MXU RGB stars that have been classified as probable non-members of the galaxy (black crosses). In the left panel, the ellipse has a semi-major axis equal to 3 times the half-light radius of the galaxy, with a position angle of 99° and ellipticity of 0.5 (see Table 1). The black dot represents the galactic center. In the right panel, gray points represent the objects classified with high confidence as stars in the Subaru/SuprimeCam photometric data (34′×27′). Magnitudes have been corrected for extinction assuming a uniform Galactic screen and adopting E(B-V) from Table 1 along with reddening law AV = 3.1 × E(B − V).
Current usage metrics show cumulative count of Article Views (full-text article views including HTML views, PDF and ePub downloads, according to the available data) and Abstracts Views on Vision4Press platform.
Data correspond to usage on the plateform after 2015. The current usage metrics is available 48-96 hours after online publication and is updated daily on week days.
Initial download of the metrics may take a while.