Fig. 5.
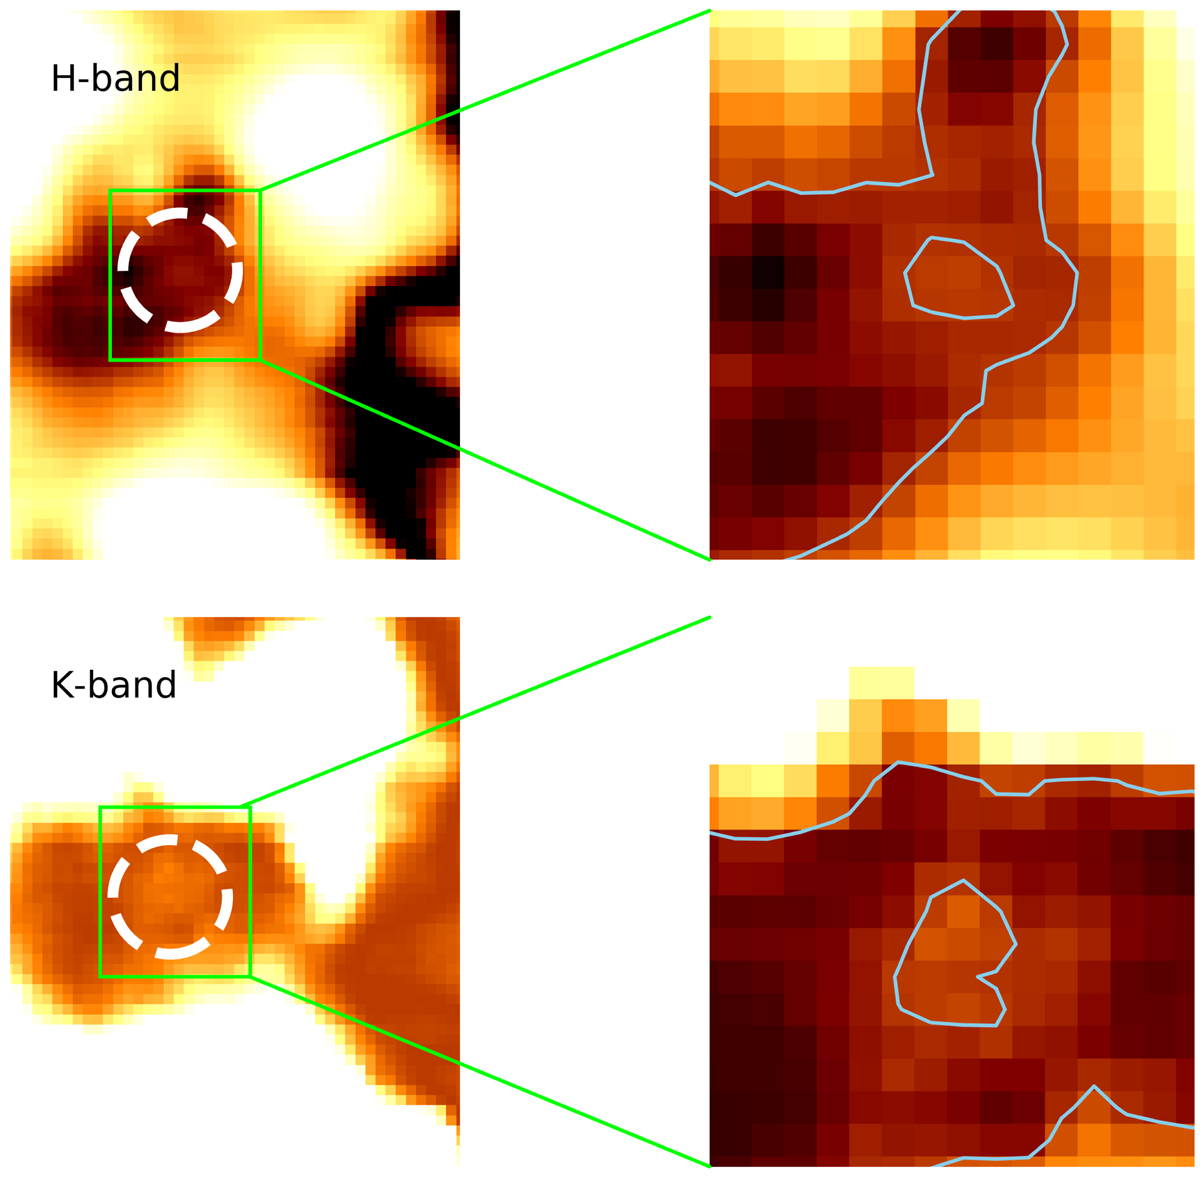
H- and K-band detection of the DSO/G2 object. Here we stack the continuum images that are used for the Lucy-Richardson detection of the DSO/G2 (see Fig. F.1). We apply for the K- and H-band detection the shifting vector from the Brγ detection. The stacked continuum emission in K- and H-band is at the expected position considering the Brγ and the Lucy-Richardson deconvolved images. In every image, north is up and east is to the left. The two overview figures to the left are ![]() . The two zoomed-in images to the right are
. The two zoomed-in images to the right are ![]() . The contour levels are at 80% of the peak intensity of the object at the expected position of the DSO/G2 (right image).
. The contour levels are at 80% of the peak intensity of the object at the expected position of the DSO/G2 (right image).
Current usage metrics show cumulative count of Article Views (full-text article views including HTML views, PDF and ePub downloads, according to the available data) and Abstracts Views on Vision4Press platform.
Data correspond to usage on the plateform after 2015. The current usage metrics is available 48-96 hours after online publication and is updated daily on week days.
Initial download of the metrics may take a while.