Fig. 4.
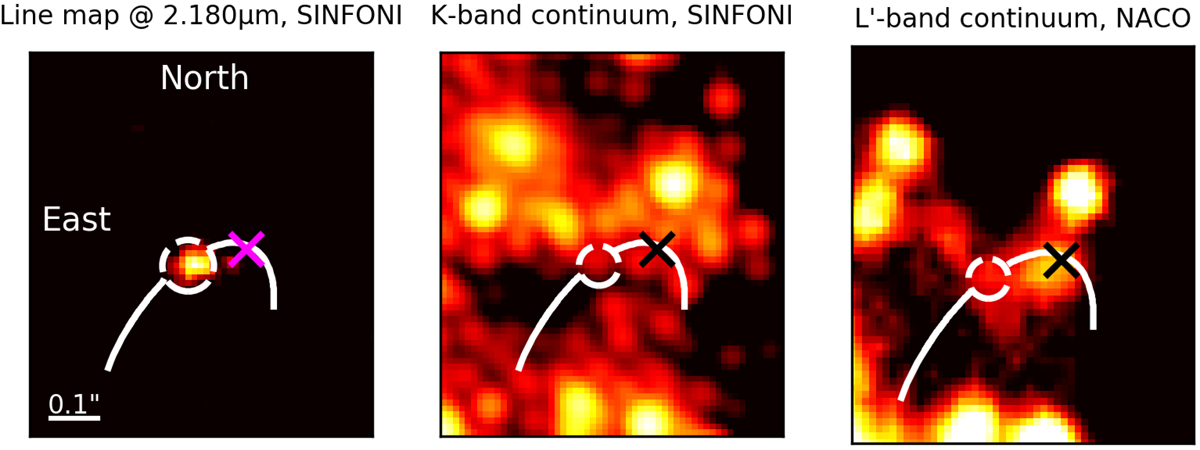
Galactic center observed in the L- and H + K band with NACO and SINFONI in 2012. North is up, east is to the left. Here, the position of the DSO/G2 is marked with a dashed circle. Sgr A* is located at the position of the “x”. The Keplerian orbital fit is based on the Brγ line maps of the DSO/G2 (left image) between 2005 and 2016. The K-band continuum image is a background-subtracted high-pass filtered image with 10 000 iterations. For the convolution and deconvolution process, a Gaussian-shaped APSF is used with an FWHM of 4.7 px. The right image is a cutout of a NACO L-band mosaic observed in 2012 with a pixel scale of 27 mas px−1. The total integration of the NACO image is ∼450 s, the on-source integration time of the SINFONI cube is ∼610 min.
Current usage metrics show cumulative count of Article Views (full-text article views including HTML views, PDF and ePub downloads, according to the available data) and Abstracts Views on Vision4Press platform.
Data correspond to usage on the plateform after 2015. The current usage metrics is available 48-96 hours after online publication and is updated daily on week days.
Initial download of the metrics may take a while.