Fig. 2.
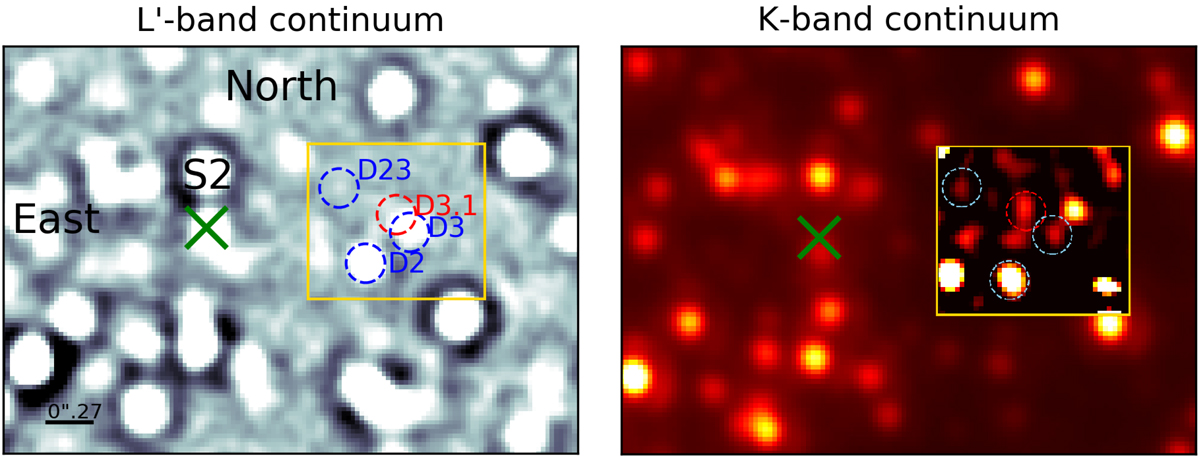
L- and K-band continuum of the GC in 2006. The approximate position of Sgr A* is indicated by a green x. Above the SMBH, the bright B2V S-star S2 can be found. The D-complex is indicated by a golden rectangle box. At the position of D2 in 2006, the S-star S43 located. However, the L-band flux of S43 is low compared to D2 (flux D2/S43 ∼ 2/1). The detected emission in this NACO image is therefore dominated by D2 in 2006. Because of the chosen contrast, D3 and D3.1 appear to be confused. Right image: same FOV in the K-band continuum. Even though this image is from 2004, the D-sources are visible at roughly the same position as in the 2006 L′-band image (left). Since their magnitudes are close to the detection limit, we use a high- and a low-pass filter to identify a K-band counterpart of the dusty sources. The inlet in the right image shows a 3 px smooth-subtracted detection of these objects.
Current usage metrics show cumulative count of Article Views (full-text article views including HTML views, PDF and ePub downloads, according to the available data) and Abstracts Views on Vision4Press platform.
Data correspond to usage on the plateform after 2015. The current usage metrics is available 48-96 hours after online publication and is updated daily on week days.
Initial download of the metrics may take a while.