Fig. E.1.
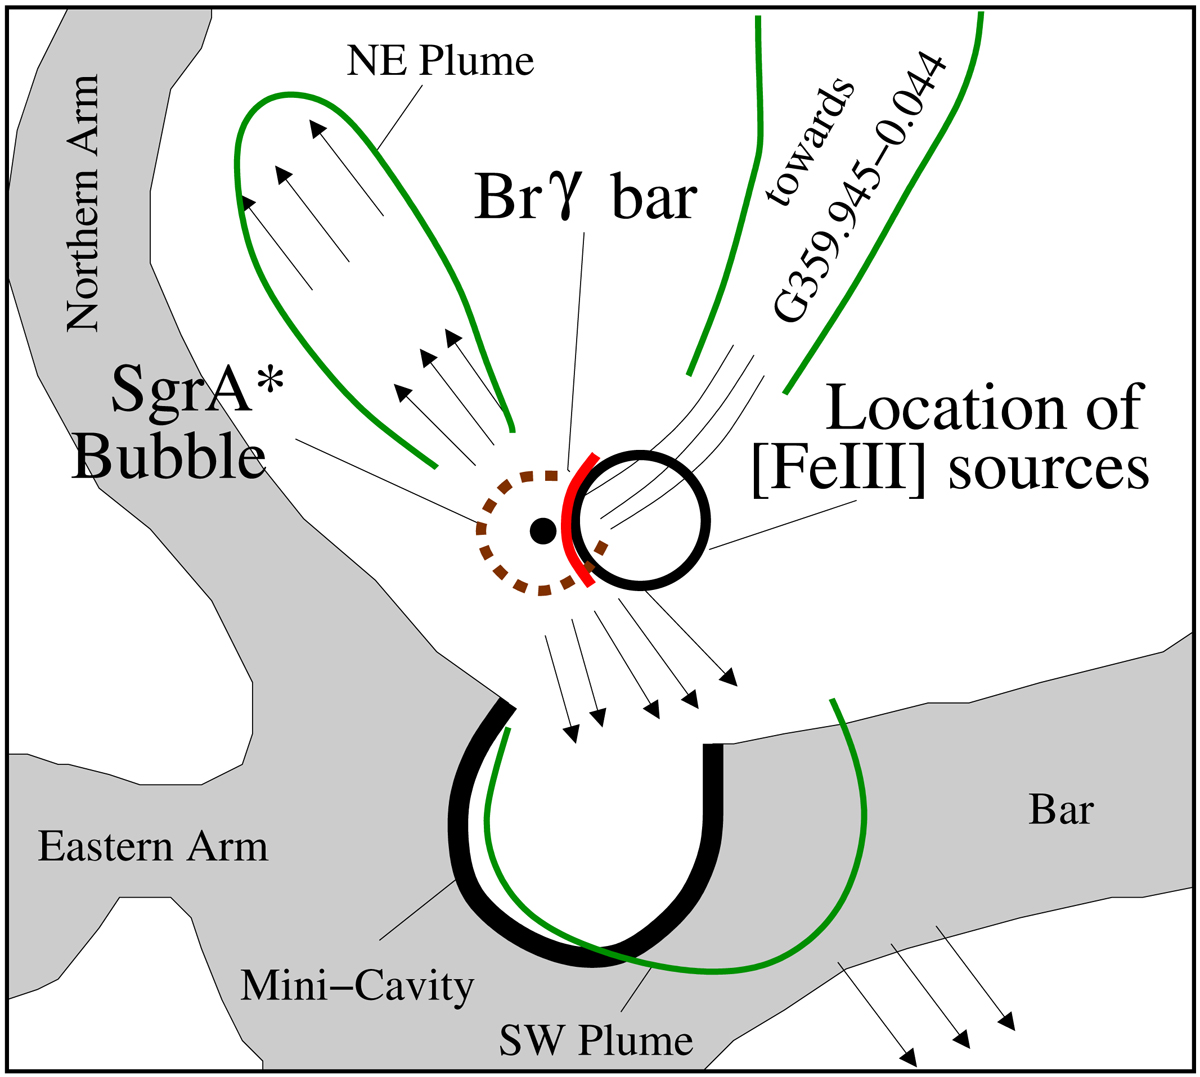
Image inspired by the results presented in Yusef-Zadeh et al. (2012). It shows the radio emission and the detected features. We indicate the position of the bright Brγ-emission with a red bar at the position of the open Sgr A* bubble. The black circle marks the position of the dusty sources that show Doppler-shifted [FeIII] emission lines.
Current usage metrics show cumulative count of Article Views (full-text article views including HTML views, PDF and ePub downloads, according to the available data) and Abstracts Views on Vision4Press platform.
Data correspond to usage on the plateform after 2015. The current usage metrics is available 48-96 hours after online publication and is updated daily on week days.
Initial download of the metrics may take a while.