Free Access
Fig. A.2.
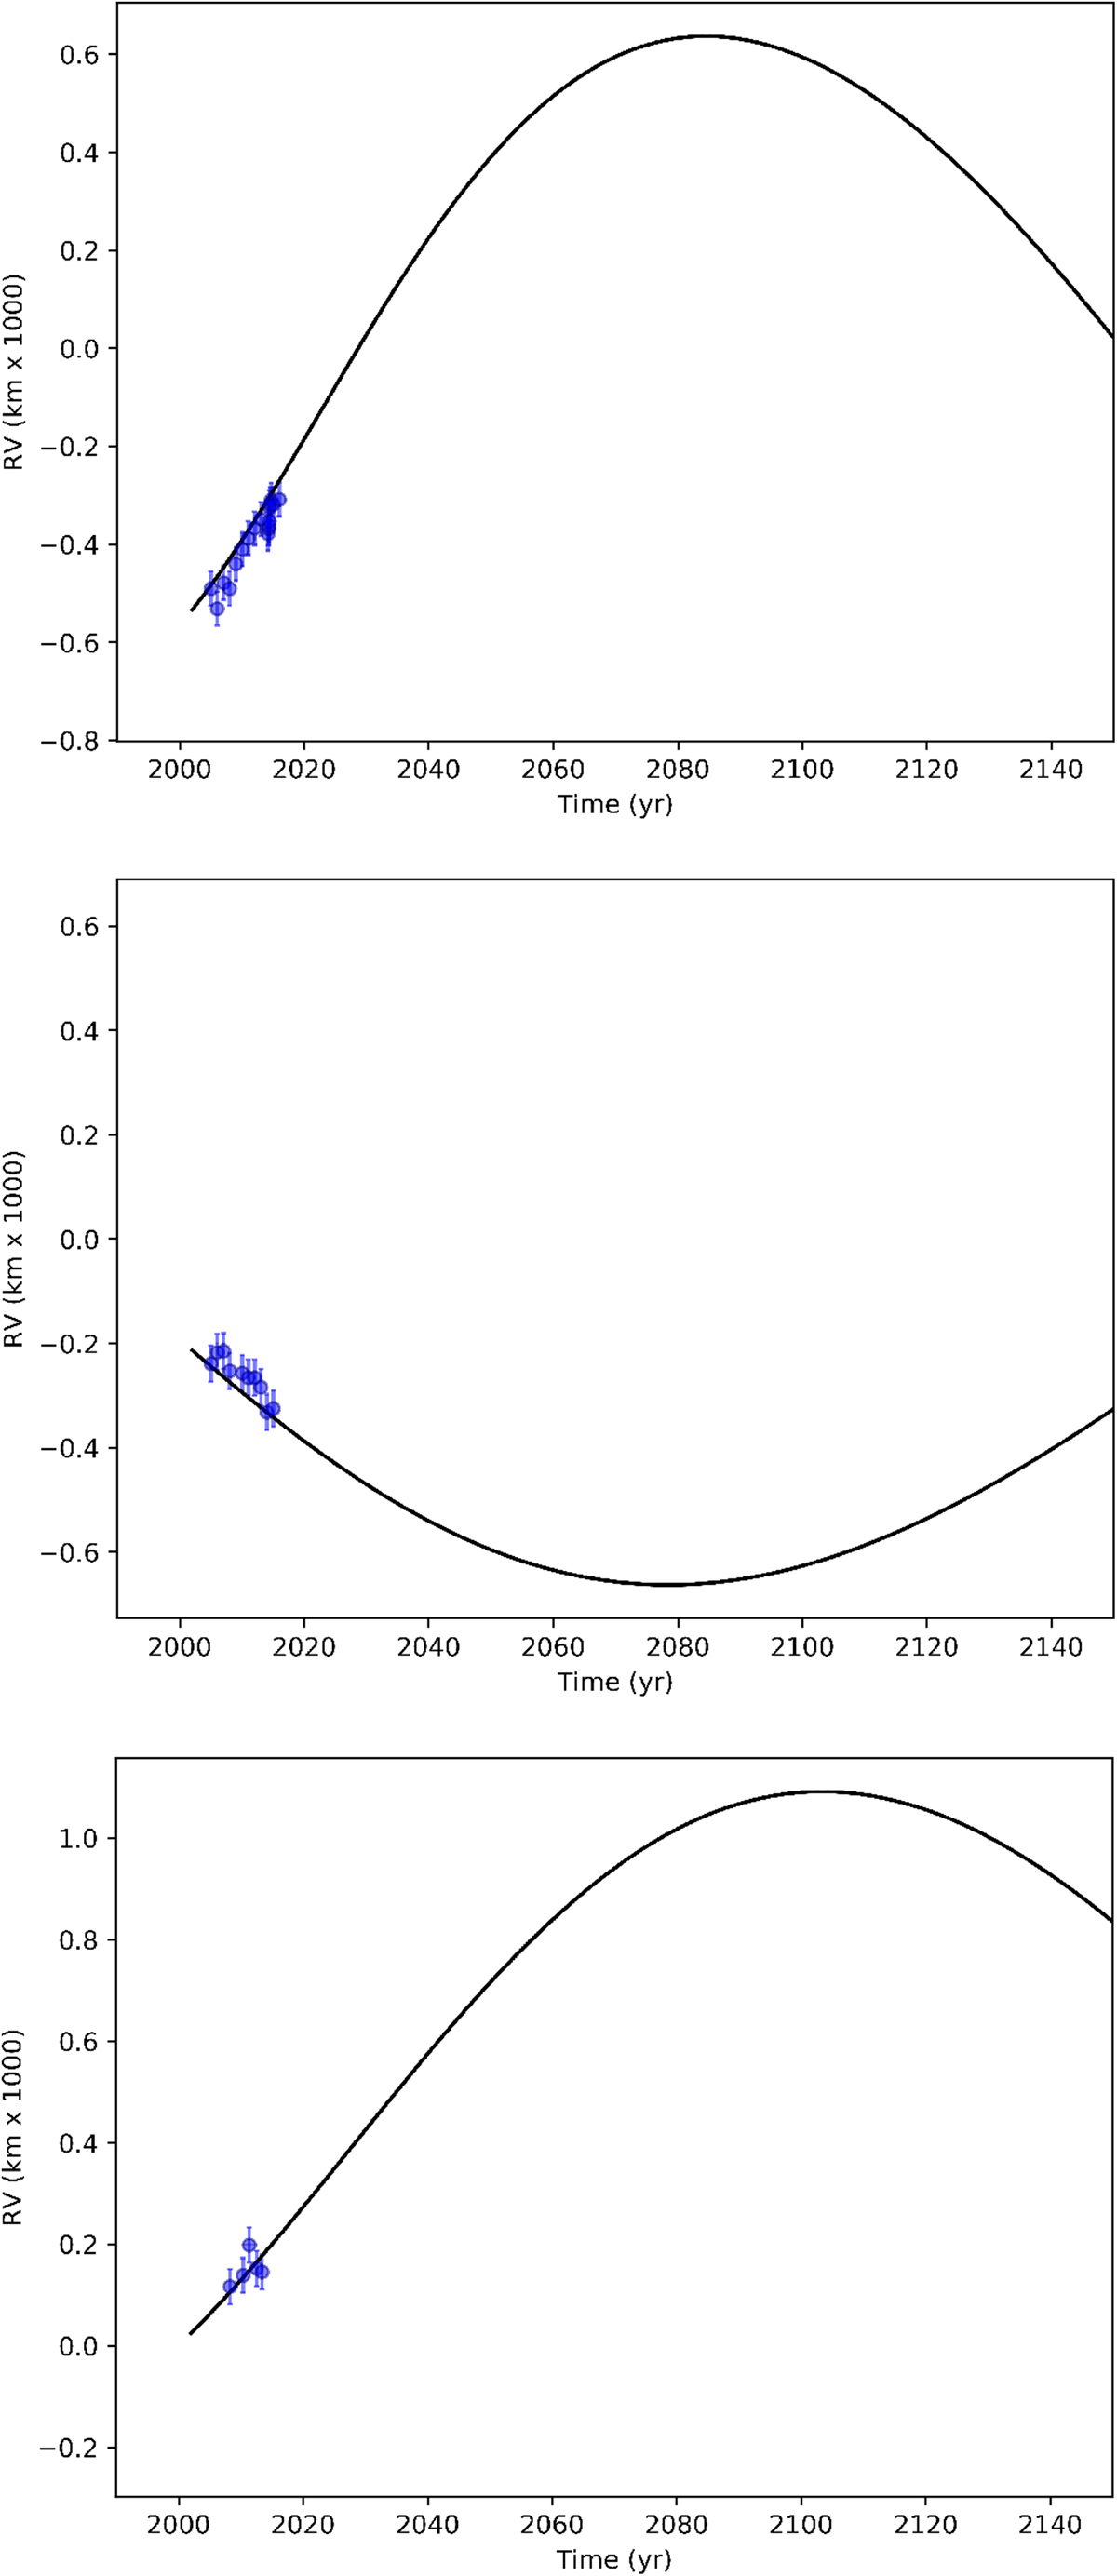
Line-of-sight velocity fit of D2, D23, and D3.1. Upper plot: LOS fit of D2, middle plot: related to D23, and lower plot: D3.1 fit. The data is extracted from the SINFONI data-cubes. Because the minimal amount of data for D3, the fit shows a poor response.
Current usage metrics show cumulative count of Article Views (full-text article views including HTML views, PDF and ePub downloads, according to the available data) and Abstracts Views on Vision4Press platform.
Data correspond to usage on the plateform after 2015. The current usage metrics is available 48-96 hours after online publication and is updated daily on week days.
Initial download of the metrics may take a while.