Fig. 9.
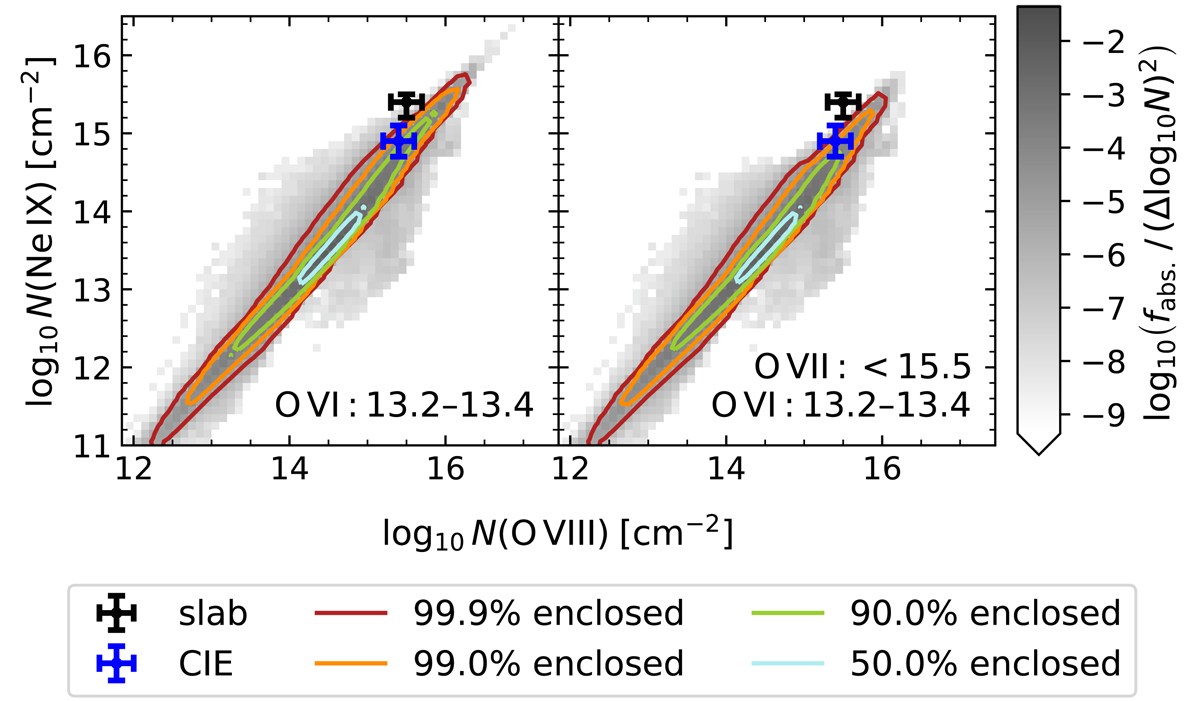
Distribution of O VIII and Ne IX column densities in counterparts to O VI absorbers (grayscale and contours) according to the EAGLE simulation, compared to the measured column densities at z = 0.09 for the CIE and slab models. Left panel: counterparts to O VI absorbers with column densities of 1013.2–1013.4 cm−2, which is roughly the ±1σ range for the FUV absorber of Tilton et al. (2012). Right panel: subset of O VI counterparts with an O VII column density in agreement with the upper limit measured with the slab model. The contours enclose different fractions of the counterparts, as indicated in the legend, while the grayscale shows the fraction of all EAGLE absorbers satisfying the indicated constraints. Although most EAGLE O VI absorbers have weaker (and hence undetectable) associated Ne IX and O VIII absorption than observed at z = 0.09 (but consistent with the non-detection for the z = 0.12 O VI absorber), both the “slab” and CIE measuremets are consistent with EAGLE at the ≈1 − 2σ level. The O VII upper limit does not affect the distribution much.
Current usage metrics show cumulative count of Article Views (full-text article views including HTML views, PDF and ePub downloads, according to the available data) and Abstracts Views on Vision4Press platform.
Data correspond to usage on the plateform after 2015. The current usage metrics is available 48-96 hours after online publication and is updated daily on week days.
Initial download of the metrics may take a while.