Fig. 8.
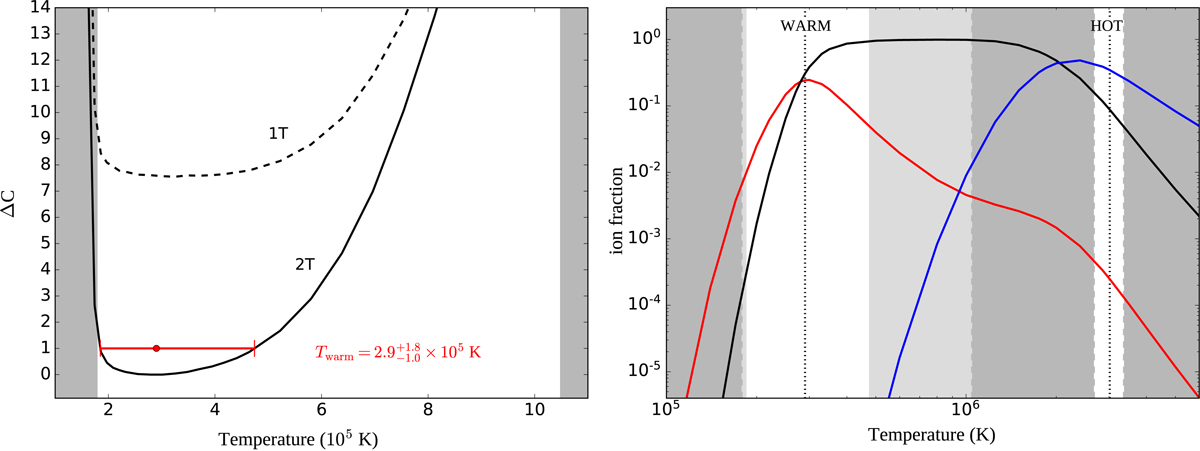
Thermal properties of the absorbing gas at z = 0.09017 assuming CIE. Left: temperature dependence of the two-phase absorption model fit statistics to the X-ray data (black solid curve) when NOVI is fixed to the FUV measured value. The shaded areas mark the forbidden regions based on the FUV measurements (the lower limit is yielded by the limits on NCIII and NOVI, whereas the upper limit is set by the O VI line broadening). The 1T curve shows the X-ray model fit statistics without the hot absorption component included, and is plotted for reference. Right: O VI (red), O VII (black) and O VIII (blue) ion fractions over the T -ranges of the warm and hot CIE components. The dotted lines mark the best-fit temperatures for both phases, while the white regions mark the 1σ uncertainty limits as yielded by X-ray data. The light gray shaded regions show the improvement which X-ray data provides to the Twarm determination as compared to the limits obtained with FUV data.
Current usage metrics show cumulative count of Article Views (full-text article views including HTML views, PDF and ePub downloads, according to the available data) and Abstracts Views on Vision4Press platform.
Data correspond to usage on the plateform after 2015. The current usage metrics is available 48-96 hours after online publication and is updated daily on week days.
Initial download of the metrics may take a while.