Fig. 7.
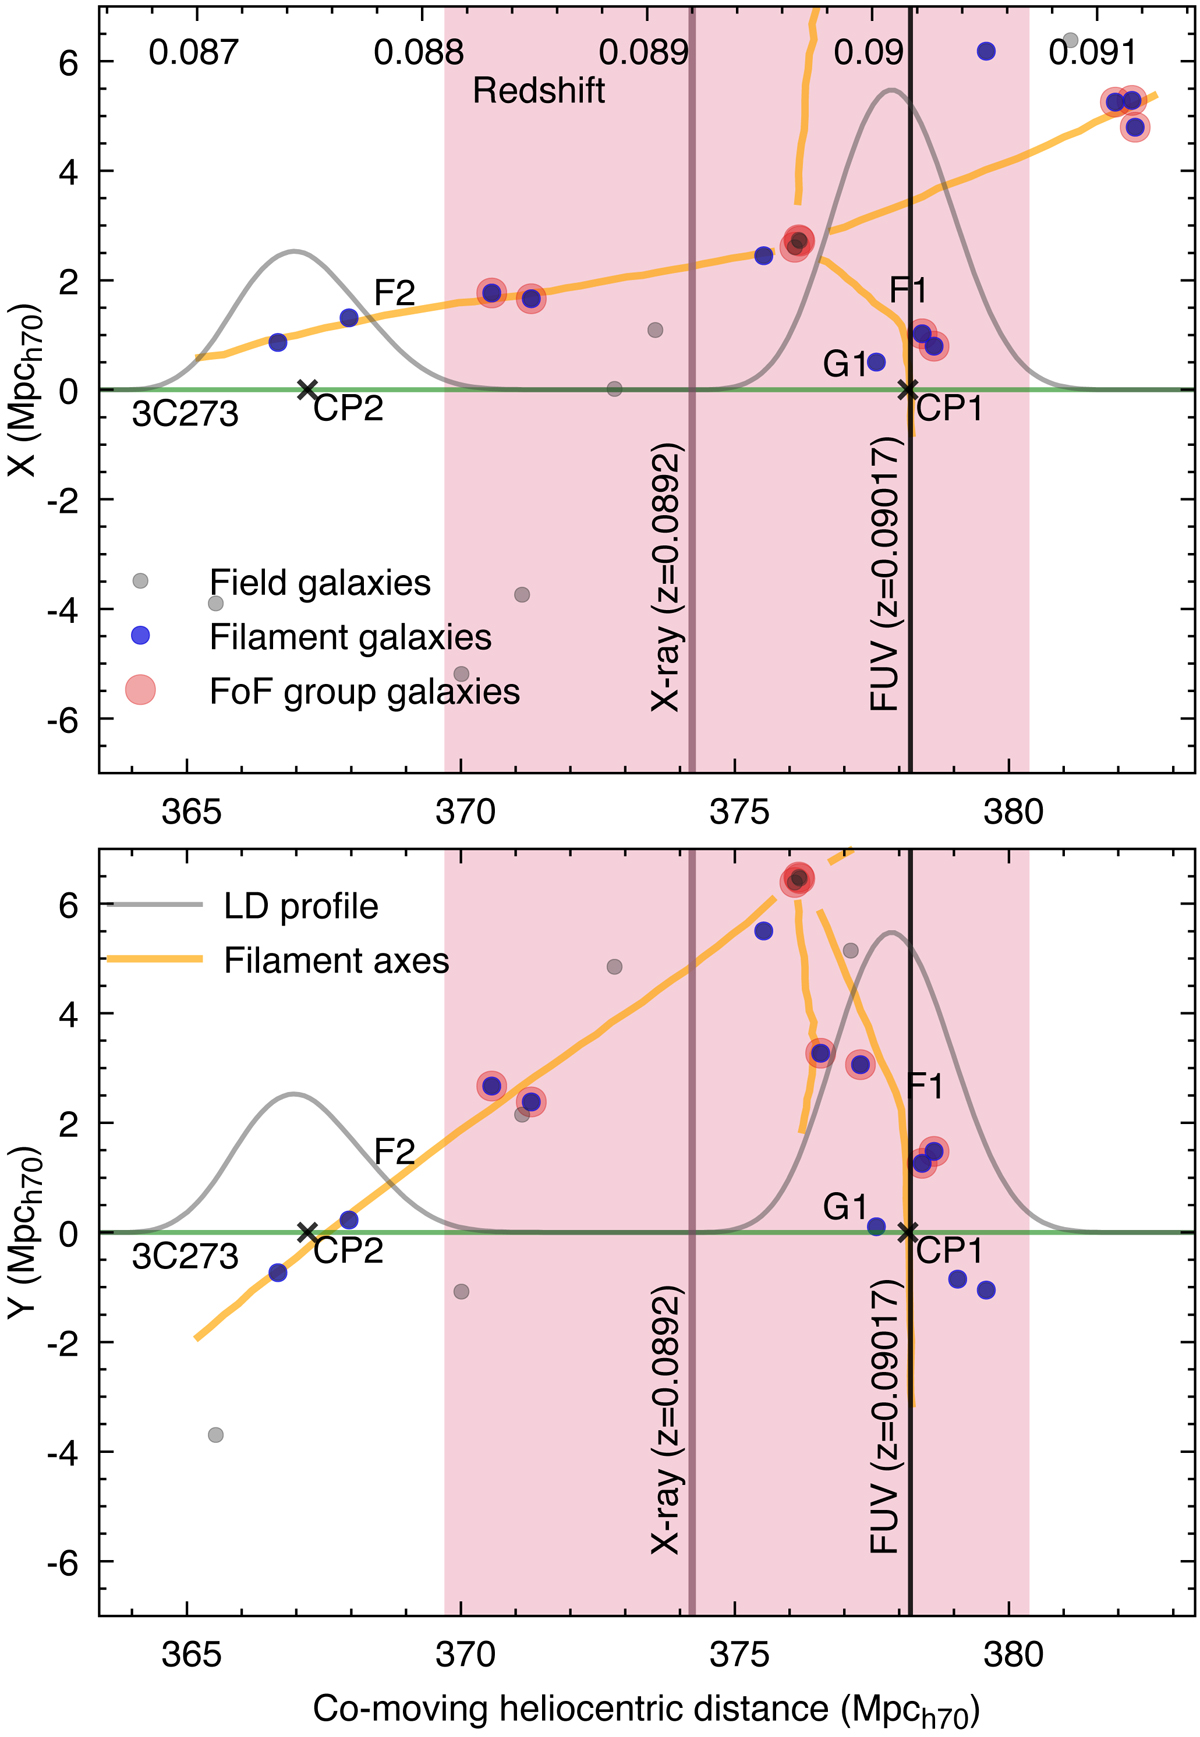
Filament analysis for 3C 273 sight-line near z = 0.09. The figure shows the distribution of SDSS galaxies (points) in two orthogonal projections (upper and lower panels), each of which are 20 Mpc thick. Blue points represent galaxies in filaments and red points indicate additional galaxies in friends-of-friends groups. The detected filament axes F1 and F2, and the associated luminosity density profiles are denoted by yellow lines and grey curves, respectively. The crossing points of the filaments F1 and F2 and the sight-line to 3C 273 are denoted with labels “CP1” and “CP2”, respectively. The redshift of the O VI absorption is marked with the black vertical line, whereas the pink vertical line and area correspond to the X-ray measured O VIII line centroid and its 1σ measurement uncertainty, obtained in the Gaussian model fit to the O VIII Lyα feature (see Table 4)
Current usage metrics show cumulative count of Article Views (full-text article views including HTML views, PDF and ePub downloads, according to the available data) and Abstracts Views on Vision4Press platform.
Data correspond to usage on the plateform after 2015. The current usage metrics is available 48-96 hours after online publication and is updated daily on week days.
Initial download of the metrics may take a while.